OneVisionby BlackHawk Data

See every
asset, license, control, user, ticket and dollar.

OneVision pulls your RMM, monitoring, service desk, security, identity and licensing data into one live view — then tells you what it means.

12 integrated data sources8 compliance frameworks1 pane of glass
ONEVISION · EXECUTIVE DASHBOARD
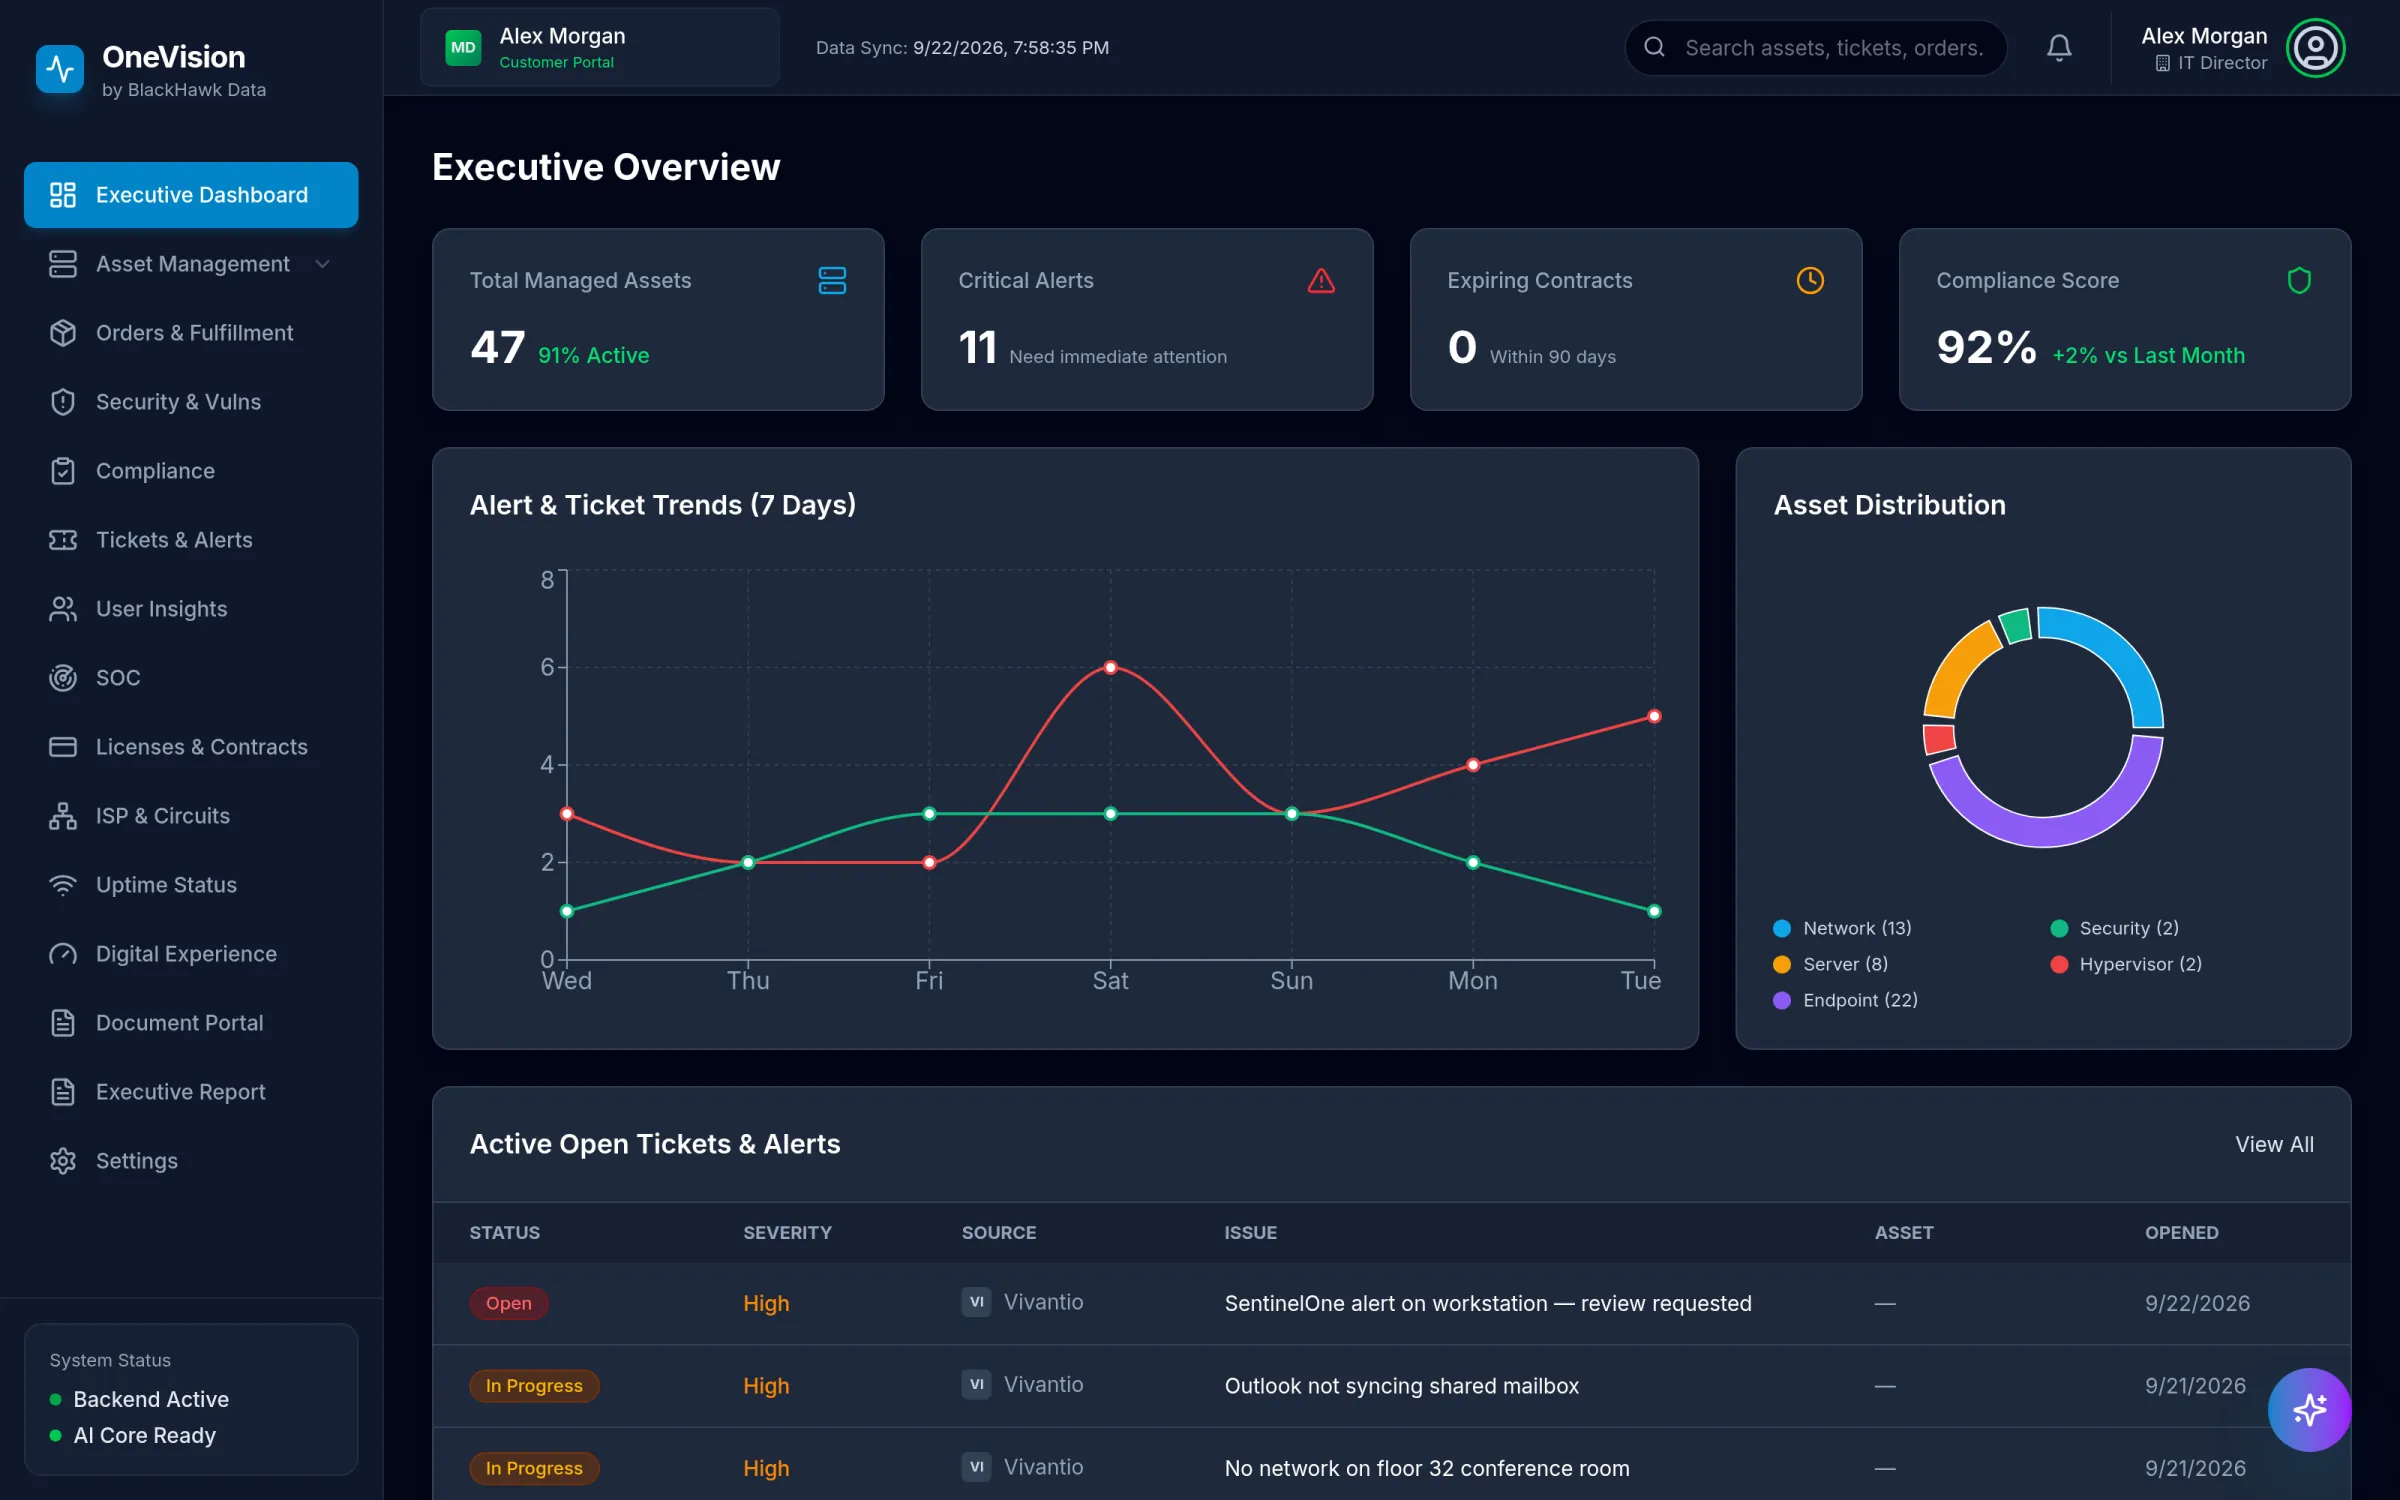
OneVision Executive Dashboard: managed asset count, critical alerts, a seven-day alert and ticket trend, asset distribution by type and a severity-ranked list of open tickets.
47managed assets · 91% active
$12,963 / yrreclaimable licenses found
8 frameworksscored every day
99.91%30-day uptime, tracked
11critical alerts, ranked
Real product screens · demo environment · fictional data
Connected, not copied

Your tools each see a slice. OneVision sees the whole.

Every source syncs on a schedule and is correlated by device and by person — so a ticket, a vulnerability, a risky sign-in and a license all land on the same asset or user.

NinjaOne RMMZabbix MonitoringVivantio Service deskHuntress SOC · EDR · ITDRMicrosoft 365 Licensing · usageMicrosoft Entra ID IdentityGoogle Workspace Identity
Uptime Kuma AvailabilityCloudflare Zero Trust ZTNATD SYNNEX OrdersShodan CVEDB VulnerabilitiesCISA KEV Exploited CVEsFalcon-CMX Digital experienceCisco EoX End of support
The tour

Eight views your team will actually use.

Scroll through real OneVision screens. The annotations point at the details that change decisions.

Visibility

The whole estate, on one screen.

01.1

Start the day with everything in one place.

Assets, alerts, tickets and trends from every connected tool — deduplicated, correlated and counted for you, not stitched together in a spreadsheet.

01.2

See the trend, not just today's fire.

Seven days of opened-versus-resolved and your asset mix by type, so a spike or a growing backlog is obvious before anyone has to ask.

01.3

One queue, sorted by what matters.

Open tickets and monitoring alerts land in a single list, ordered by severity and then age — whichever tool they came from.
ONEVISION
Executive Dashboard with asset, alert and trend widgets.
147 managed assets, 91% active — RMM and monitoring combined
2Critical alerts counted — one click opens the filtered queue
1Opened vs. resolved, last 7 days
2Asset mix by type, at a glance
1Status and severity first
2Every source in one list, oldest critical on top
Assets & lifecycle

Every device, circuit and contract — with its story.

02.1

One record per device, from every tool.

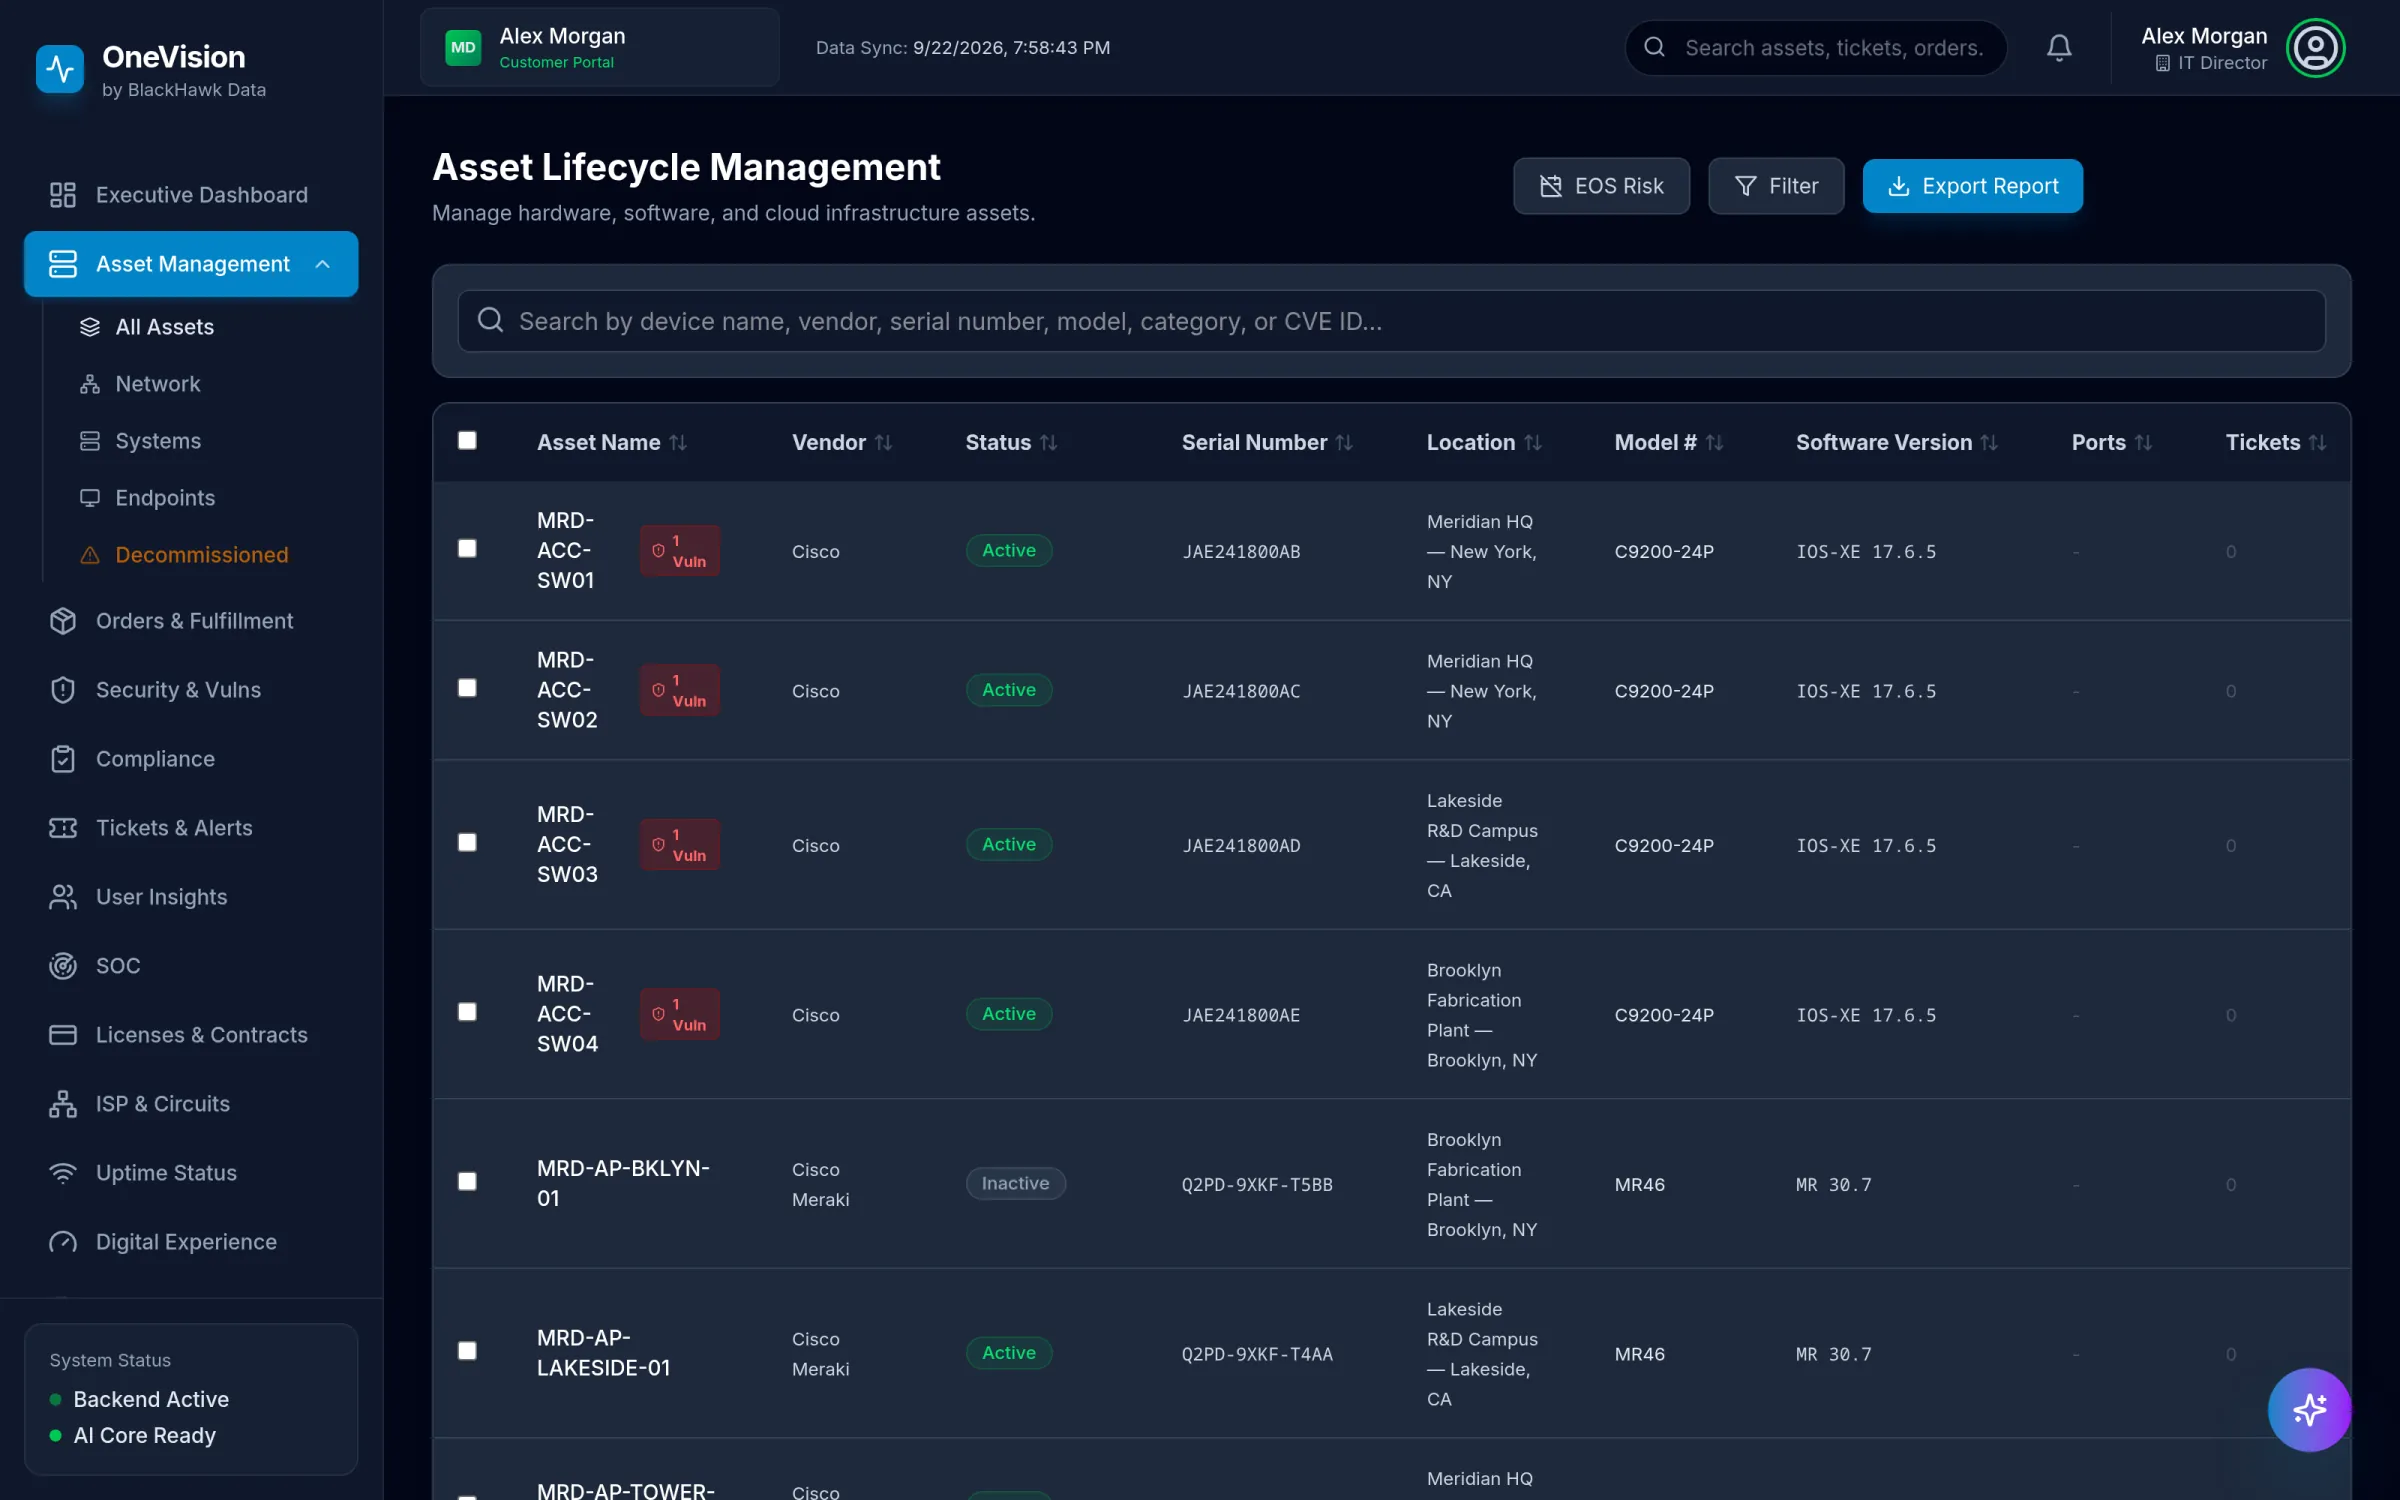
Hardware, firmware, location, vulnerabilities and open tickets for each device, merged from your RMM, monitoring and network tools.

02.2

Lifecycle risk before it becomes an outage.

End-of-support dates are looked up automatically — Cisco EoX, endoflife.date and vendor sources — so replacement planning starts early, not after the last patch ships.

02.3

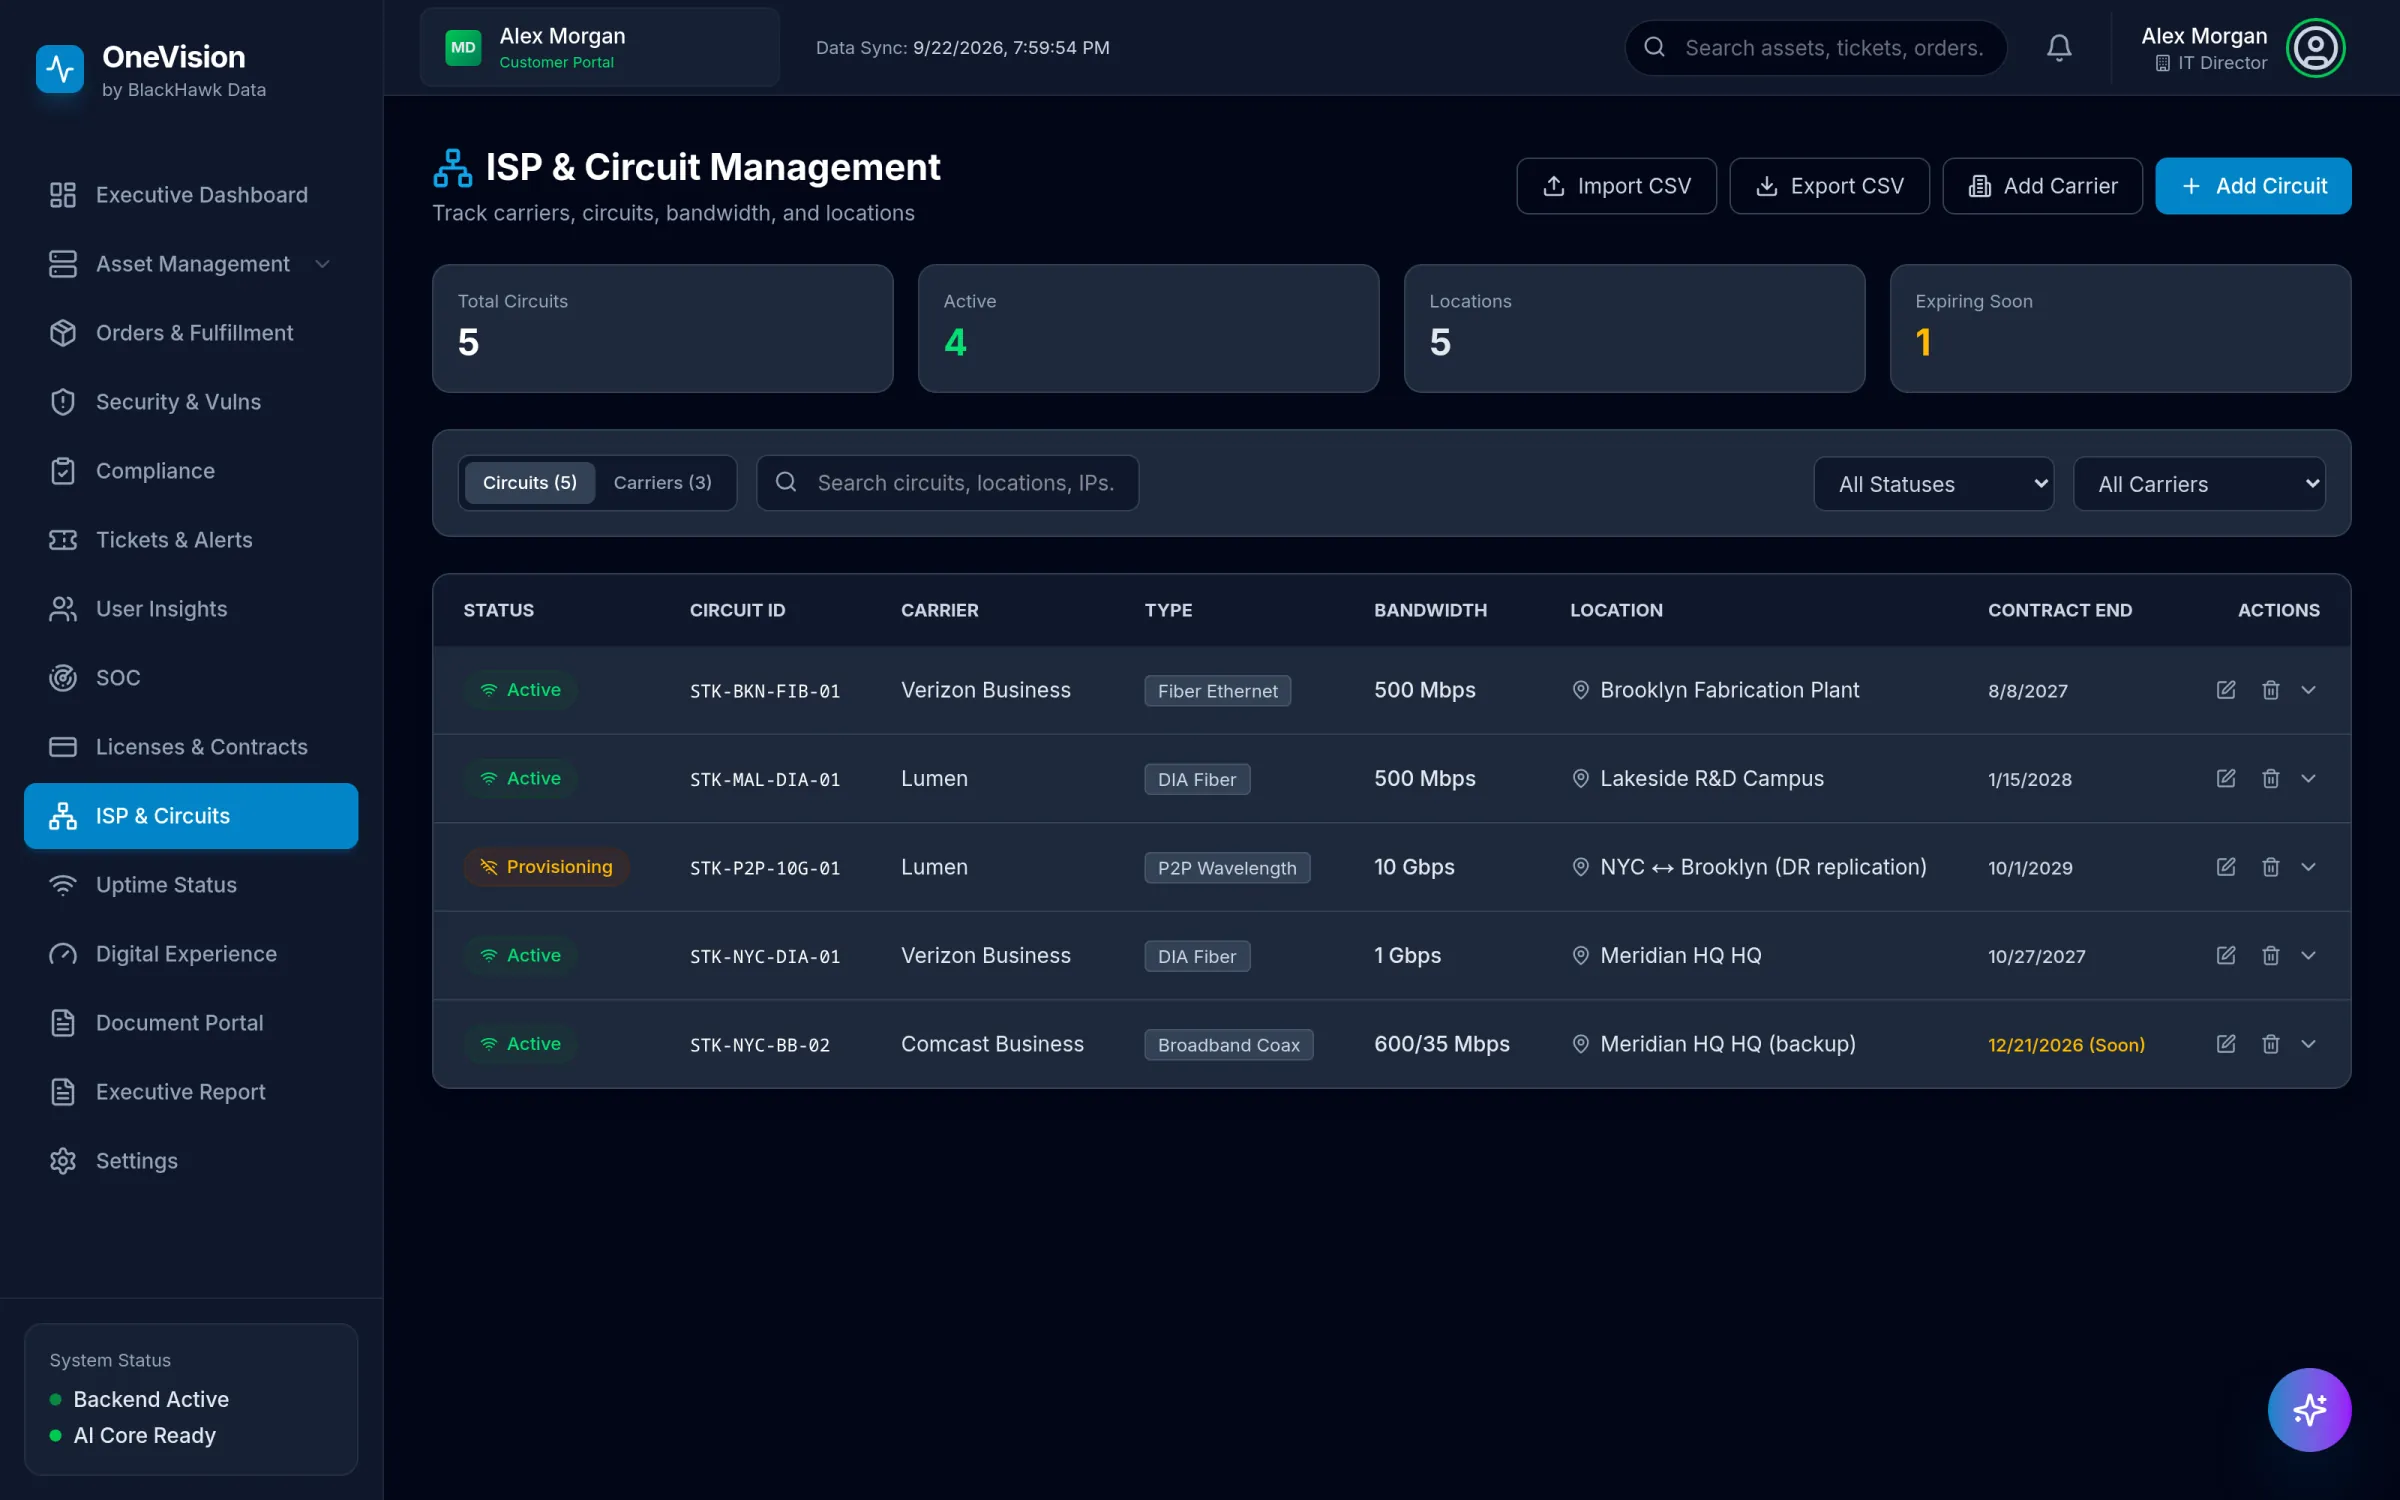
Circuits and carriers, next to the gear they serve.

Every ISP circuit with its carrier, bandwidth, location and contract end date, with renewals flagged well before they roll over.

ONEVISION
Asset Lifecycle Management table listing devices with vendor, status, serial number, location, model and software version.
ISP and Circuit Management register with carrier, circuit type, bandwidth, location and contract end dates.
1Known vulnerabilities flagged on the device itself
2Model, firmware and location filled in automatically
1EOS Risk: everything past or near end of support, in one click
2Auto-sorted into Network, Systems and Endpoints
3Search by name, serial, model — or CVE ID
1Circuits with contracts ending soon
2Carrier, type and bandwidth in one register
3Renewal flagged within 90 days
Security

Risk ranked by what's actually exploited.

03.1

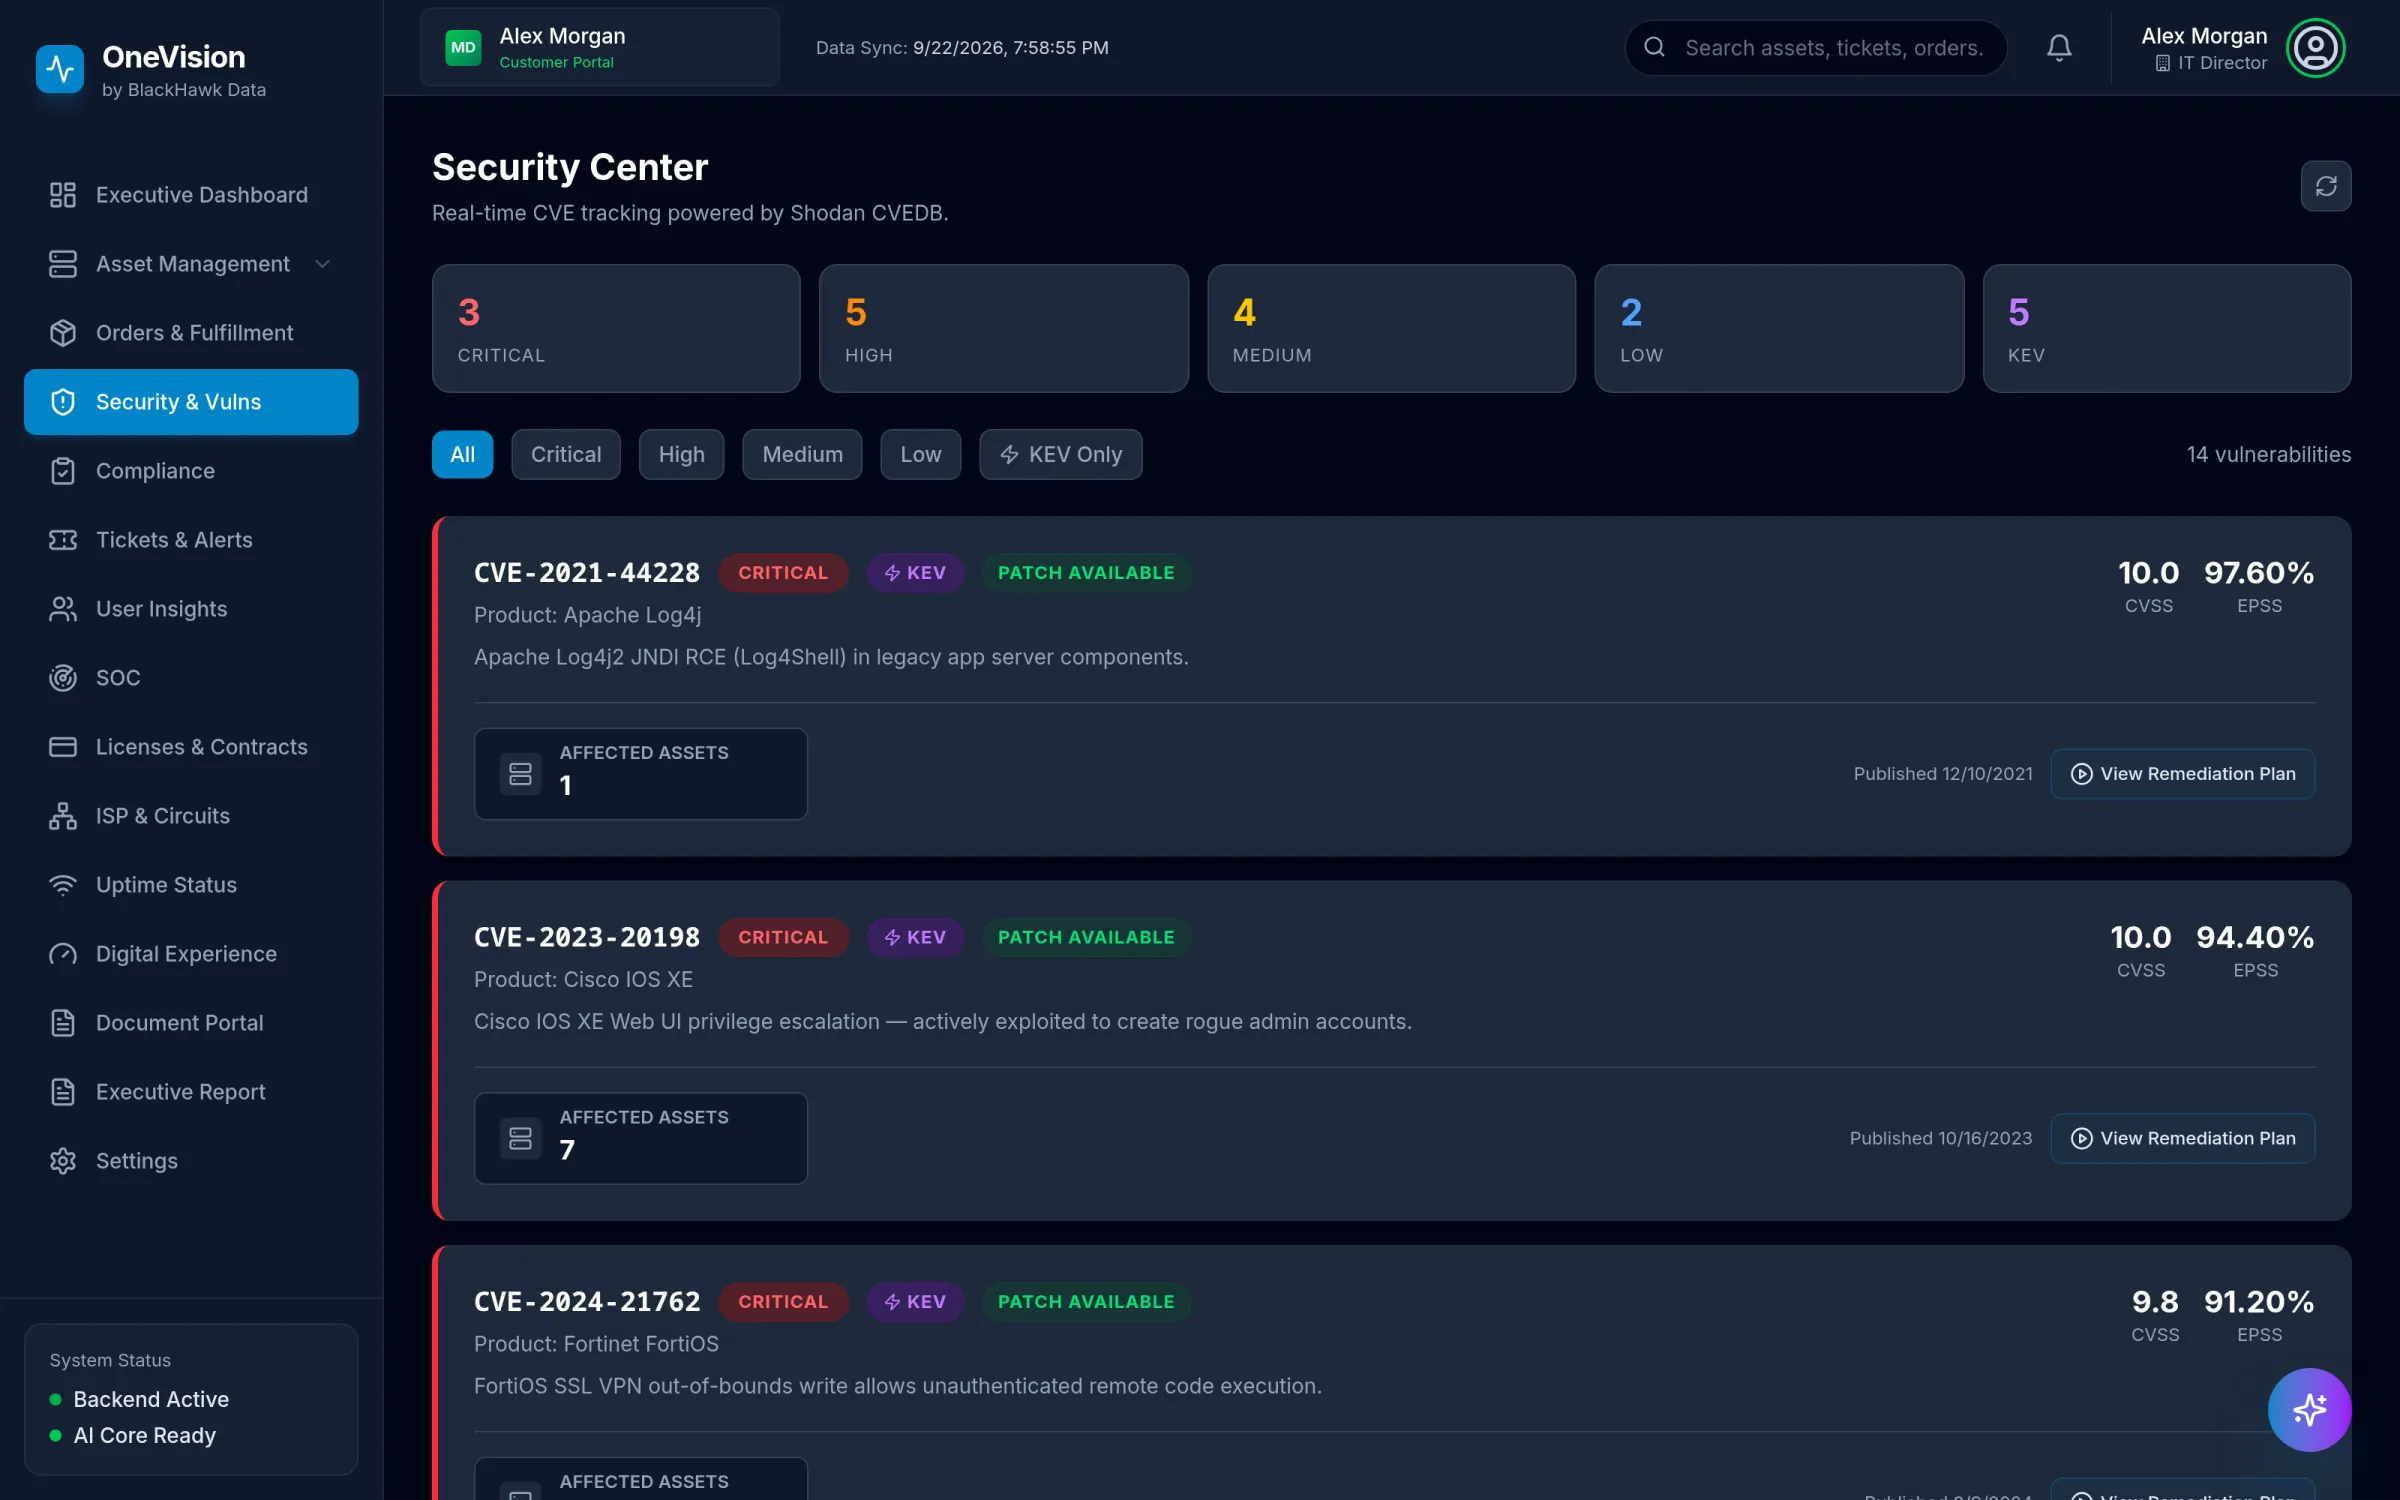
Vulnerabilities prioritized the way attackers do.

CVEs are matched against your own inventory and ranked with CISA's Known Exploited Vulnerabilities list and EPSS exploit probability — not just a raw CVSS number.

03.2

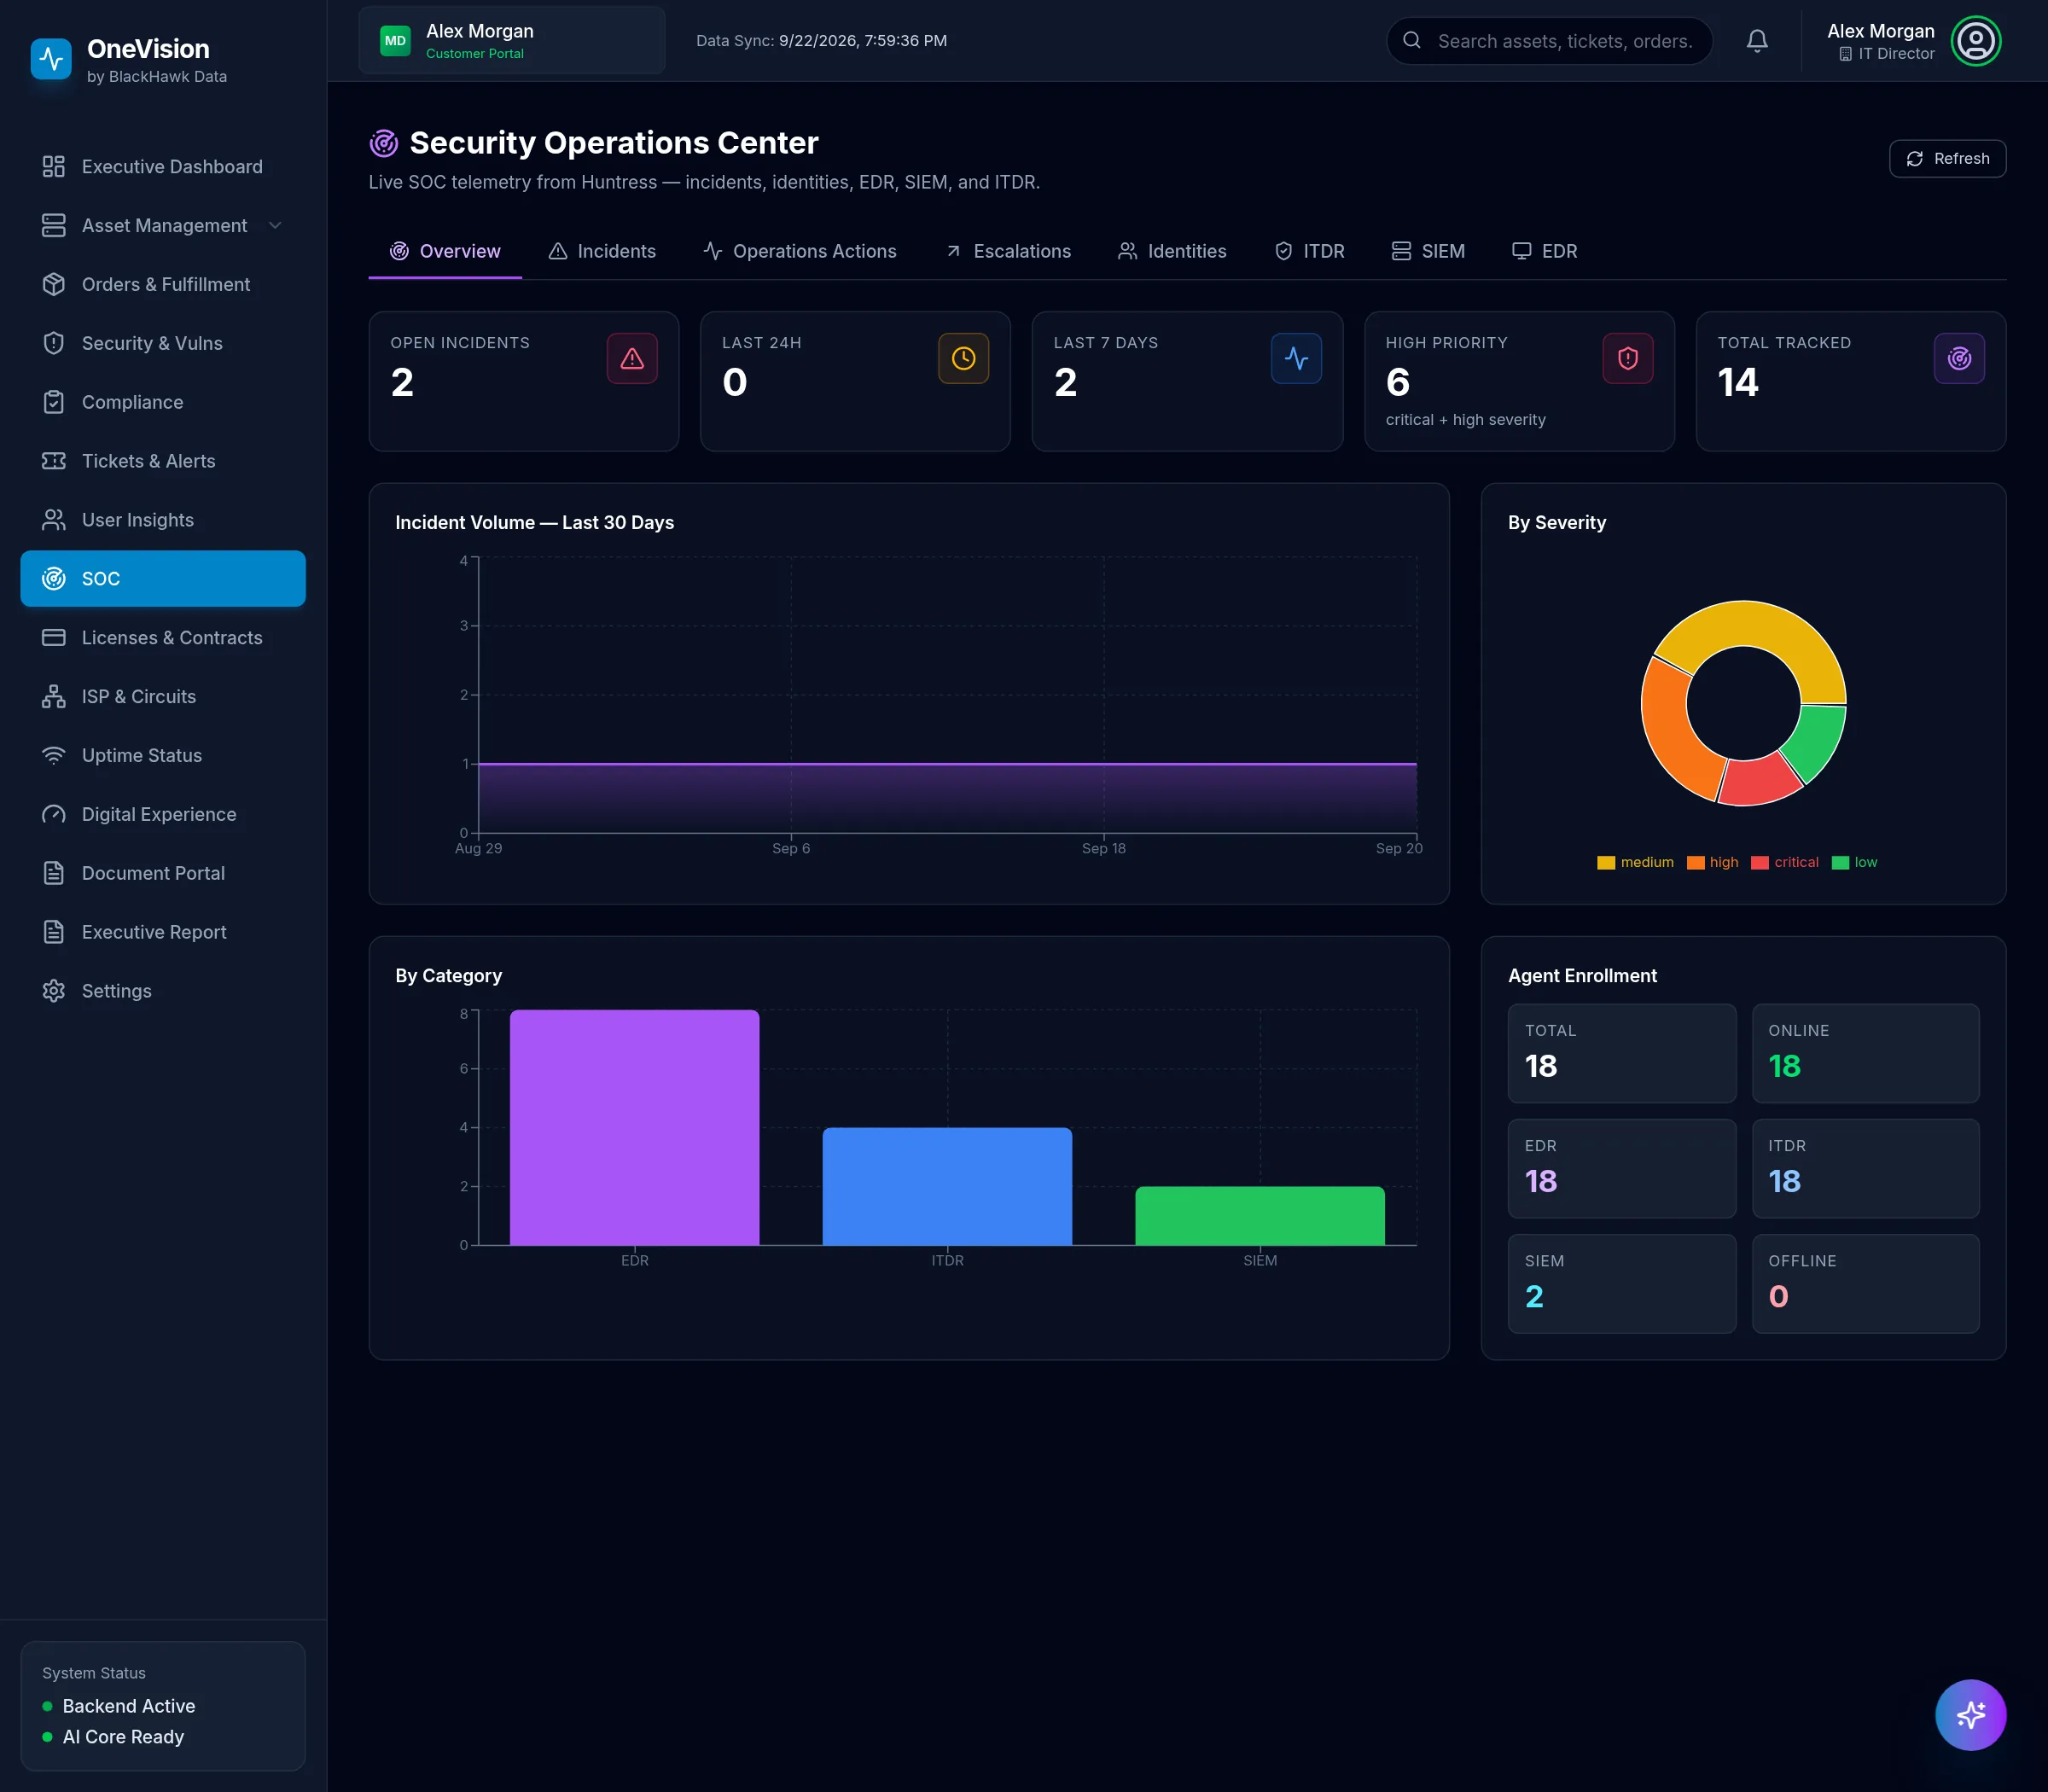
Your SOC, in plain view.

Huntress SOC incidents, escalations and identity threats alongside endpoint coverage — the same telemetry the analysts work from, without another console.

ONEVISION
Security Center listing CVEs with severity, CISA KEV badge, CVSS and EPSS scores and affected asset counts.
Security Operations Center overview with incident counts, 30-day incident volume, severity and category breakdowns and agent enrollment.
1CISA KEV: known-exploited CVEs matched to your devices
2CVSS severity plus EPSS exploit probability
3Exactly which of your assets are exposed
1Incidents, escalations, identities, ITDR, SIEM, EDR
2Open, last 24 hours, last 7 days
3EDR, ITDR and SIEM coverage across endpoints
Compliance

Audit-ready on an ordinary Tuesday.

04.1

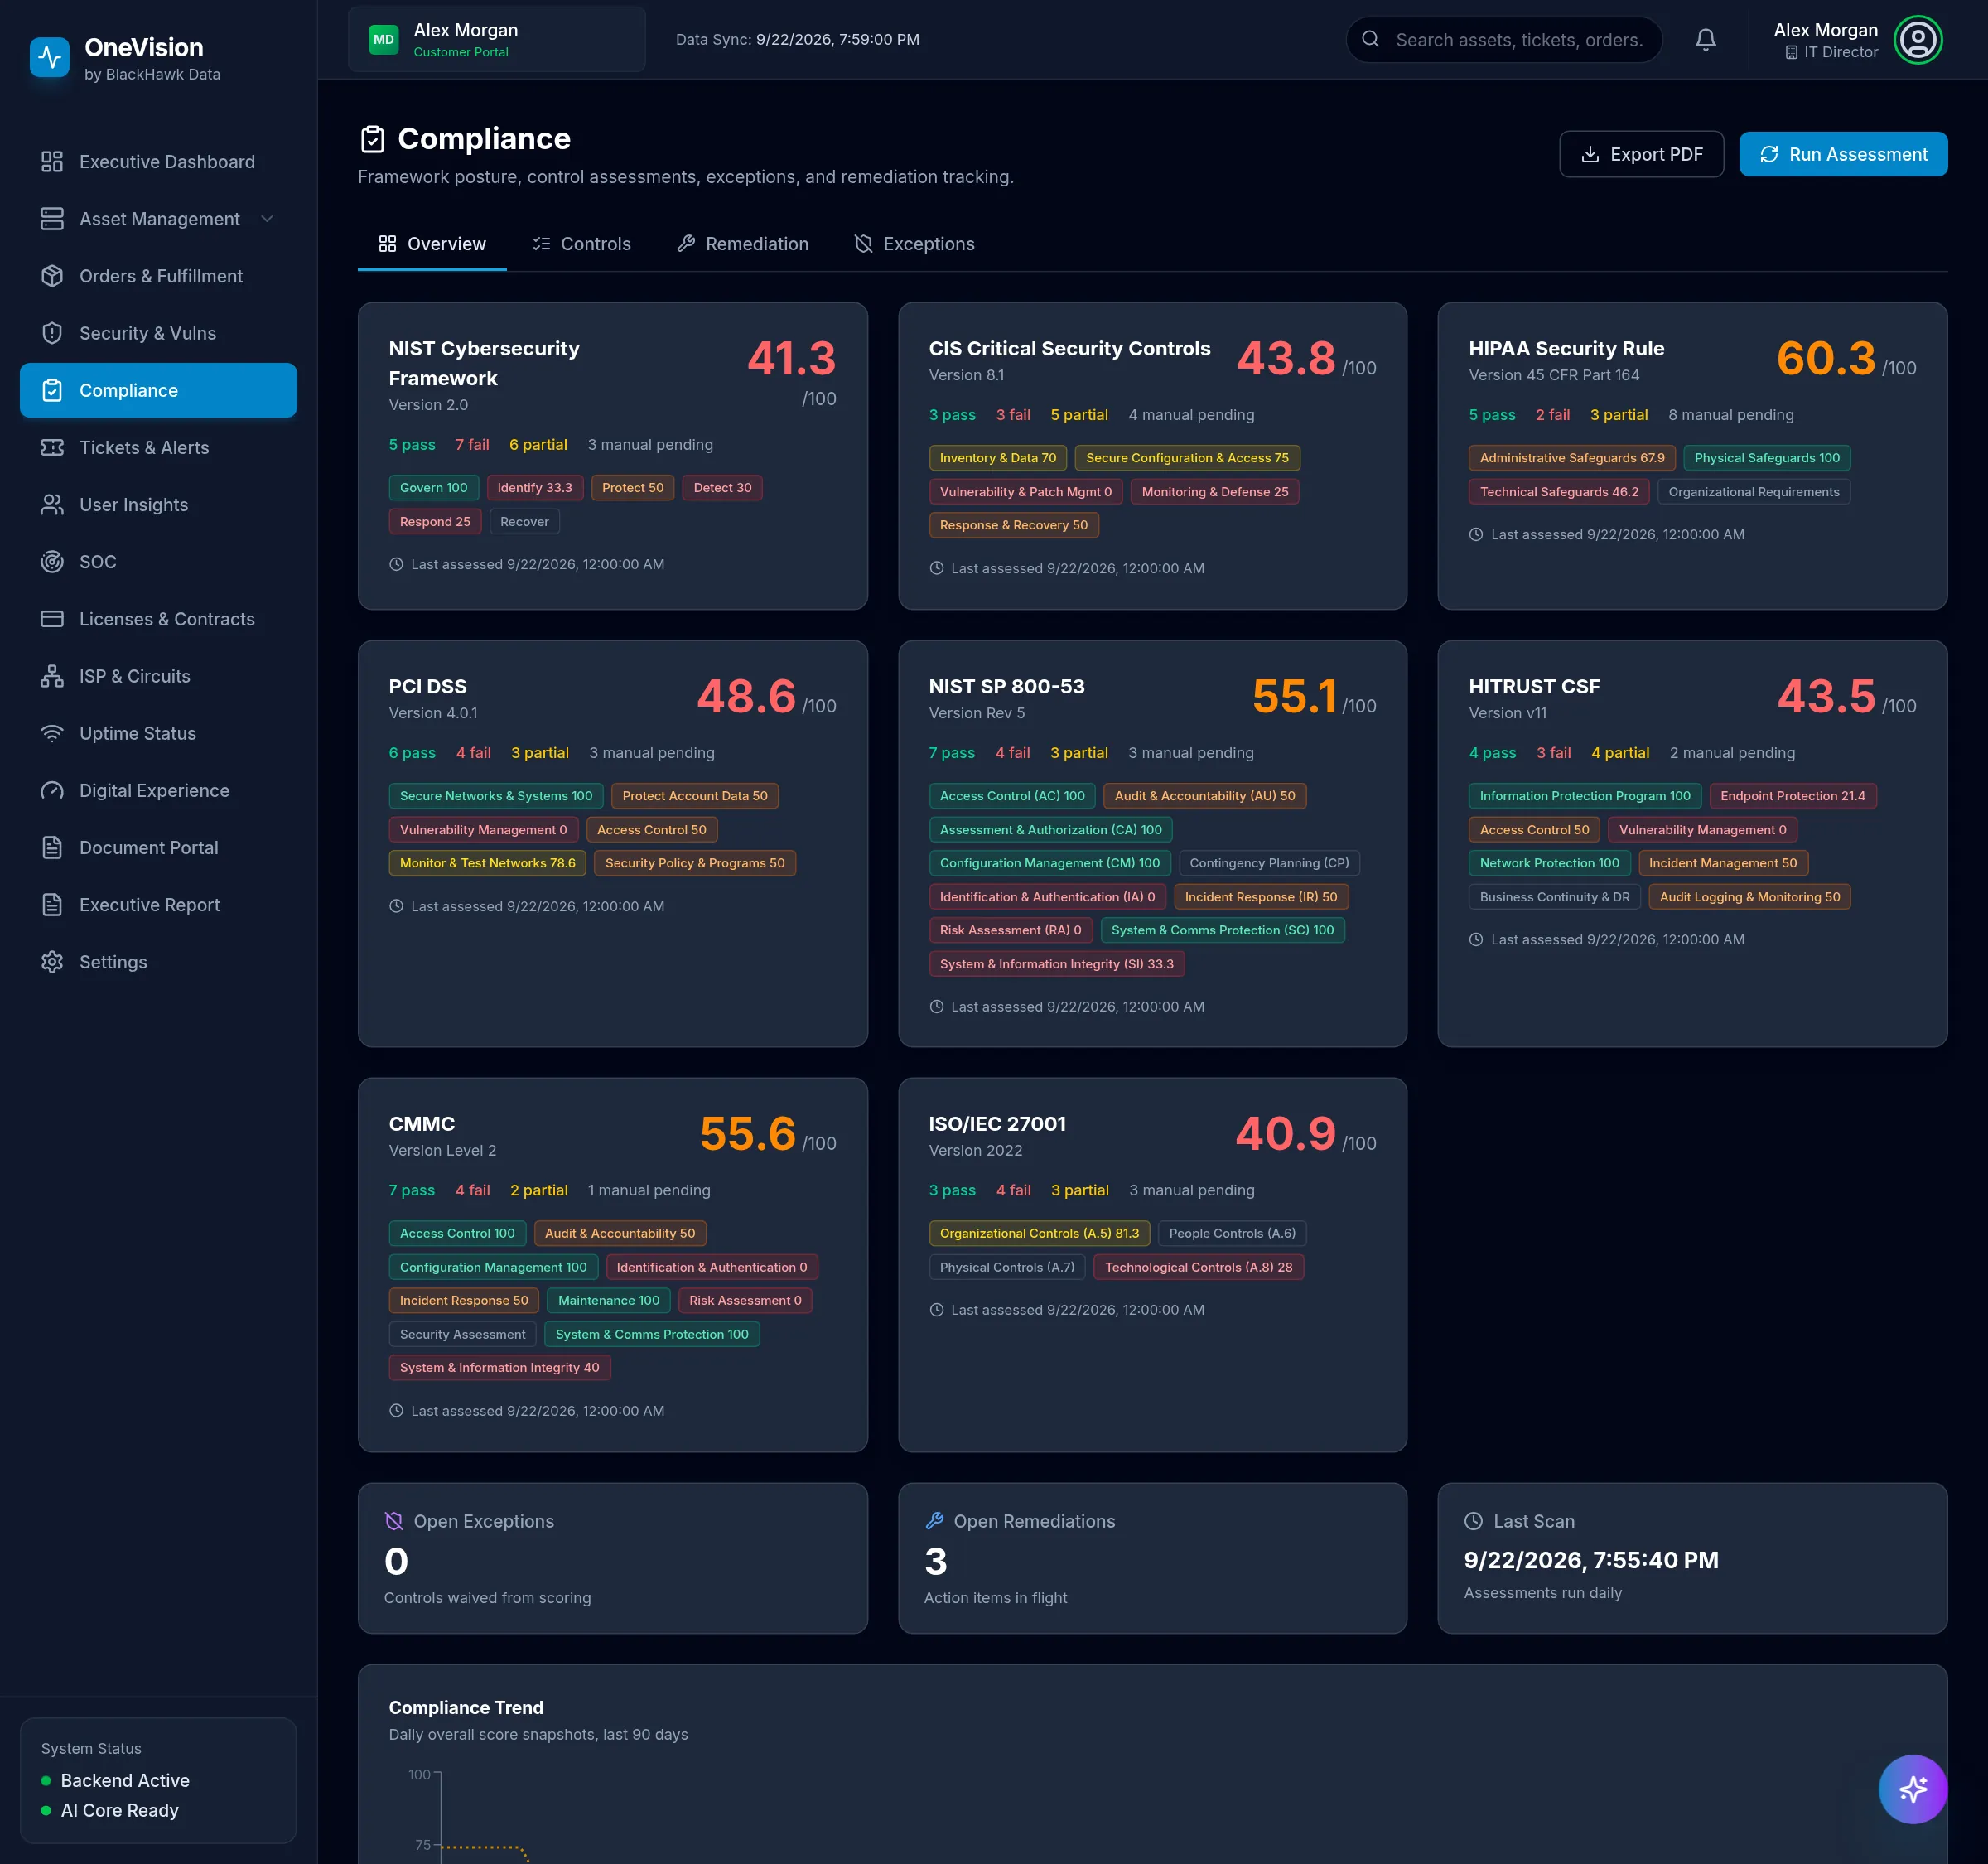
Eight frameworks, scored every day.

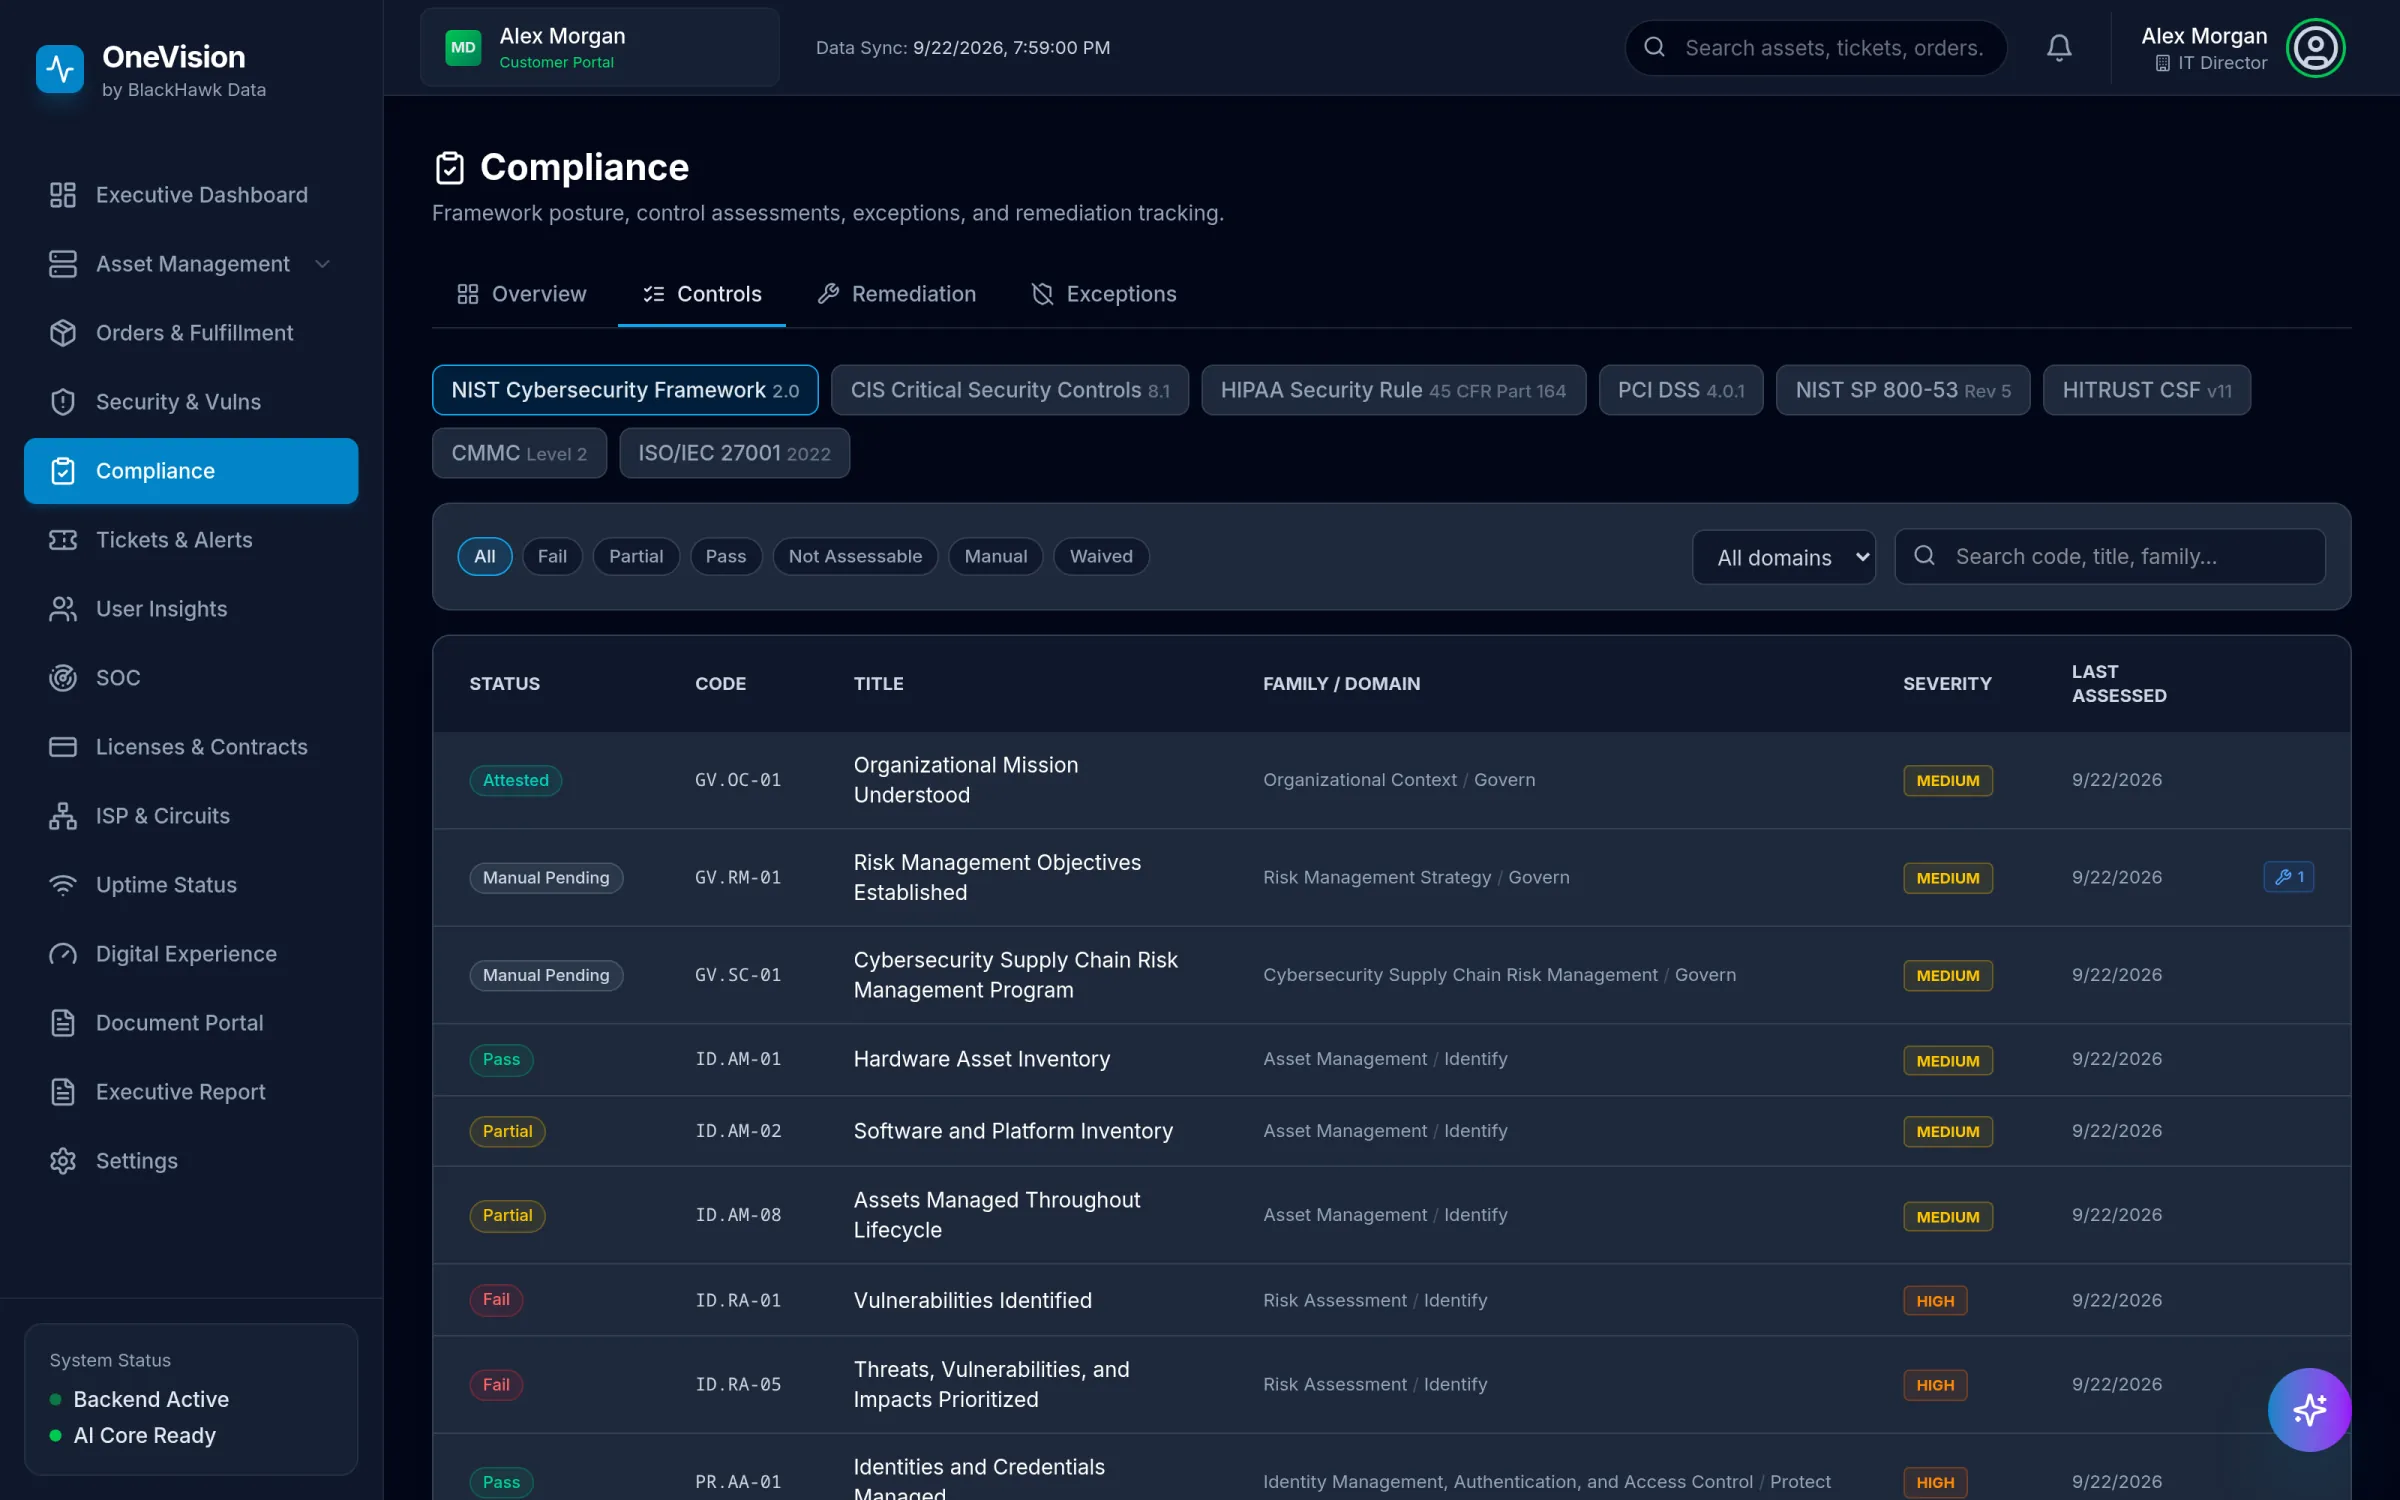
NIST CSF 2.0, CIS v8, HIPAA, PCI DSS 4.0, NIST 800-53, HITRUST, CMMC Level 2 and ISO 27001 — scored continuously from evidence OneVision already collects. No questionnaire to start.

04.2

Gaps come with a path to closed.

Failing controls become remediation items with an owner, a priority and a due date, and can open a ticket. Exceptions carry a reason and an expiry, so waivers don't live forever.

04.3

Down to the individual control.

Every control shows its status, the evidence behind it and when it was last assessed. Policy controls are attested by your team, with the evidence on file.

ONEVISION
Compliance overview with scores for NIST CSF, CIS Controls, HIPAA, PCI DSS, NIST 800-53, HITRUST, CMMC and ISO 27001, plus open exceptions and remediations.
Compliance controls table showing each control's status, code, title, domain, severity and last assessment date.
10–100 per framework, re-assessed daily
2Domain breakdown shows exactly where the gaps are
3Healthcare, payments, defense and ISO, side by side
1Exceptions tracked, each with an expiry
2Remediations in flight, with owners
3Assessments run automatically every day
1Pass, partial or fail — graded from live data
2Switch frameworks without re-collecting evidence
3Manual controls attested, with evidence
Identity & users

Know your riskiest users — and why.

05.1

A risk score for every person.

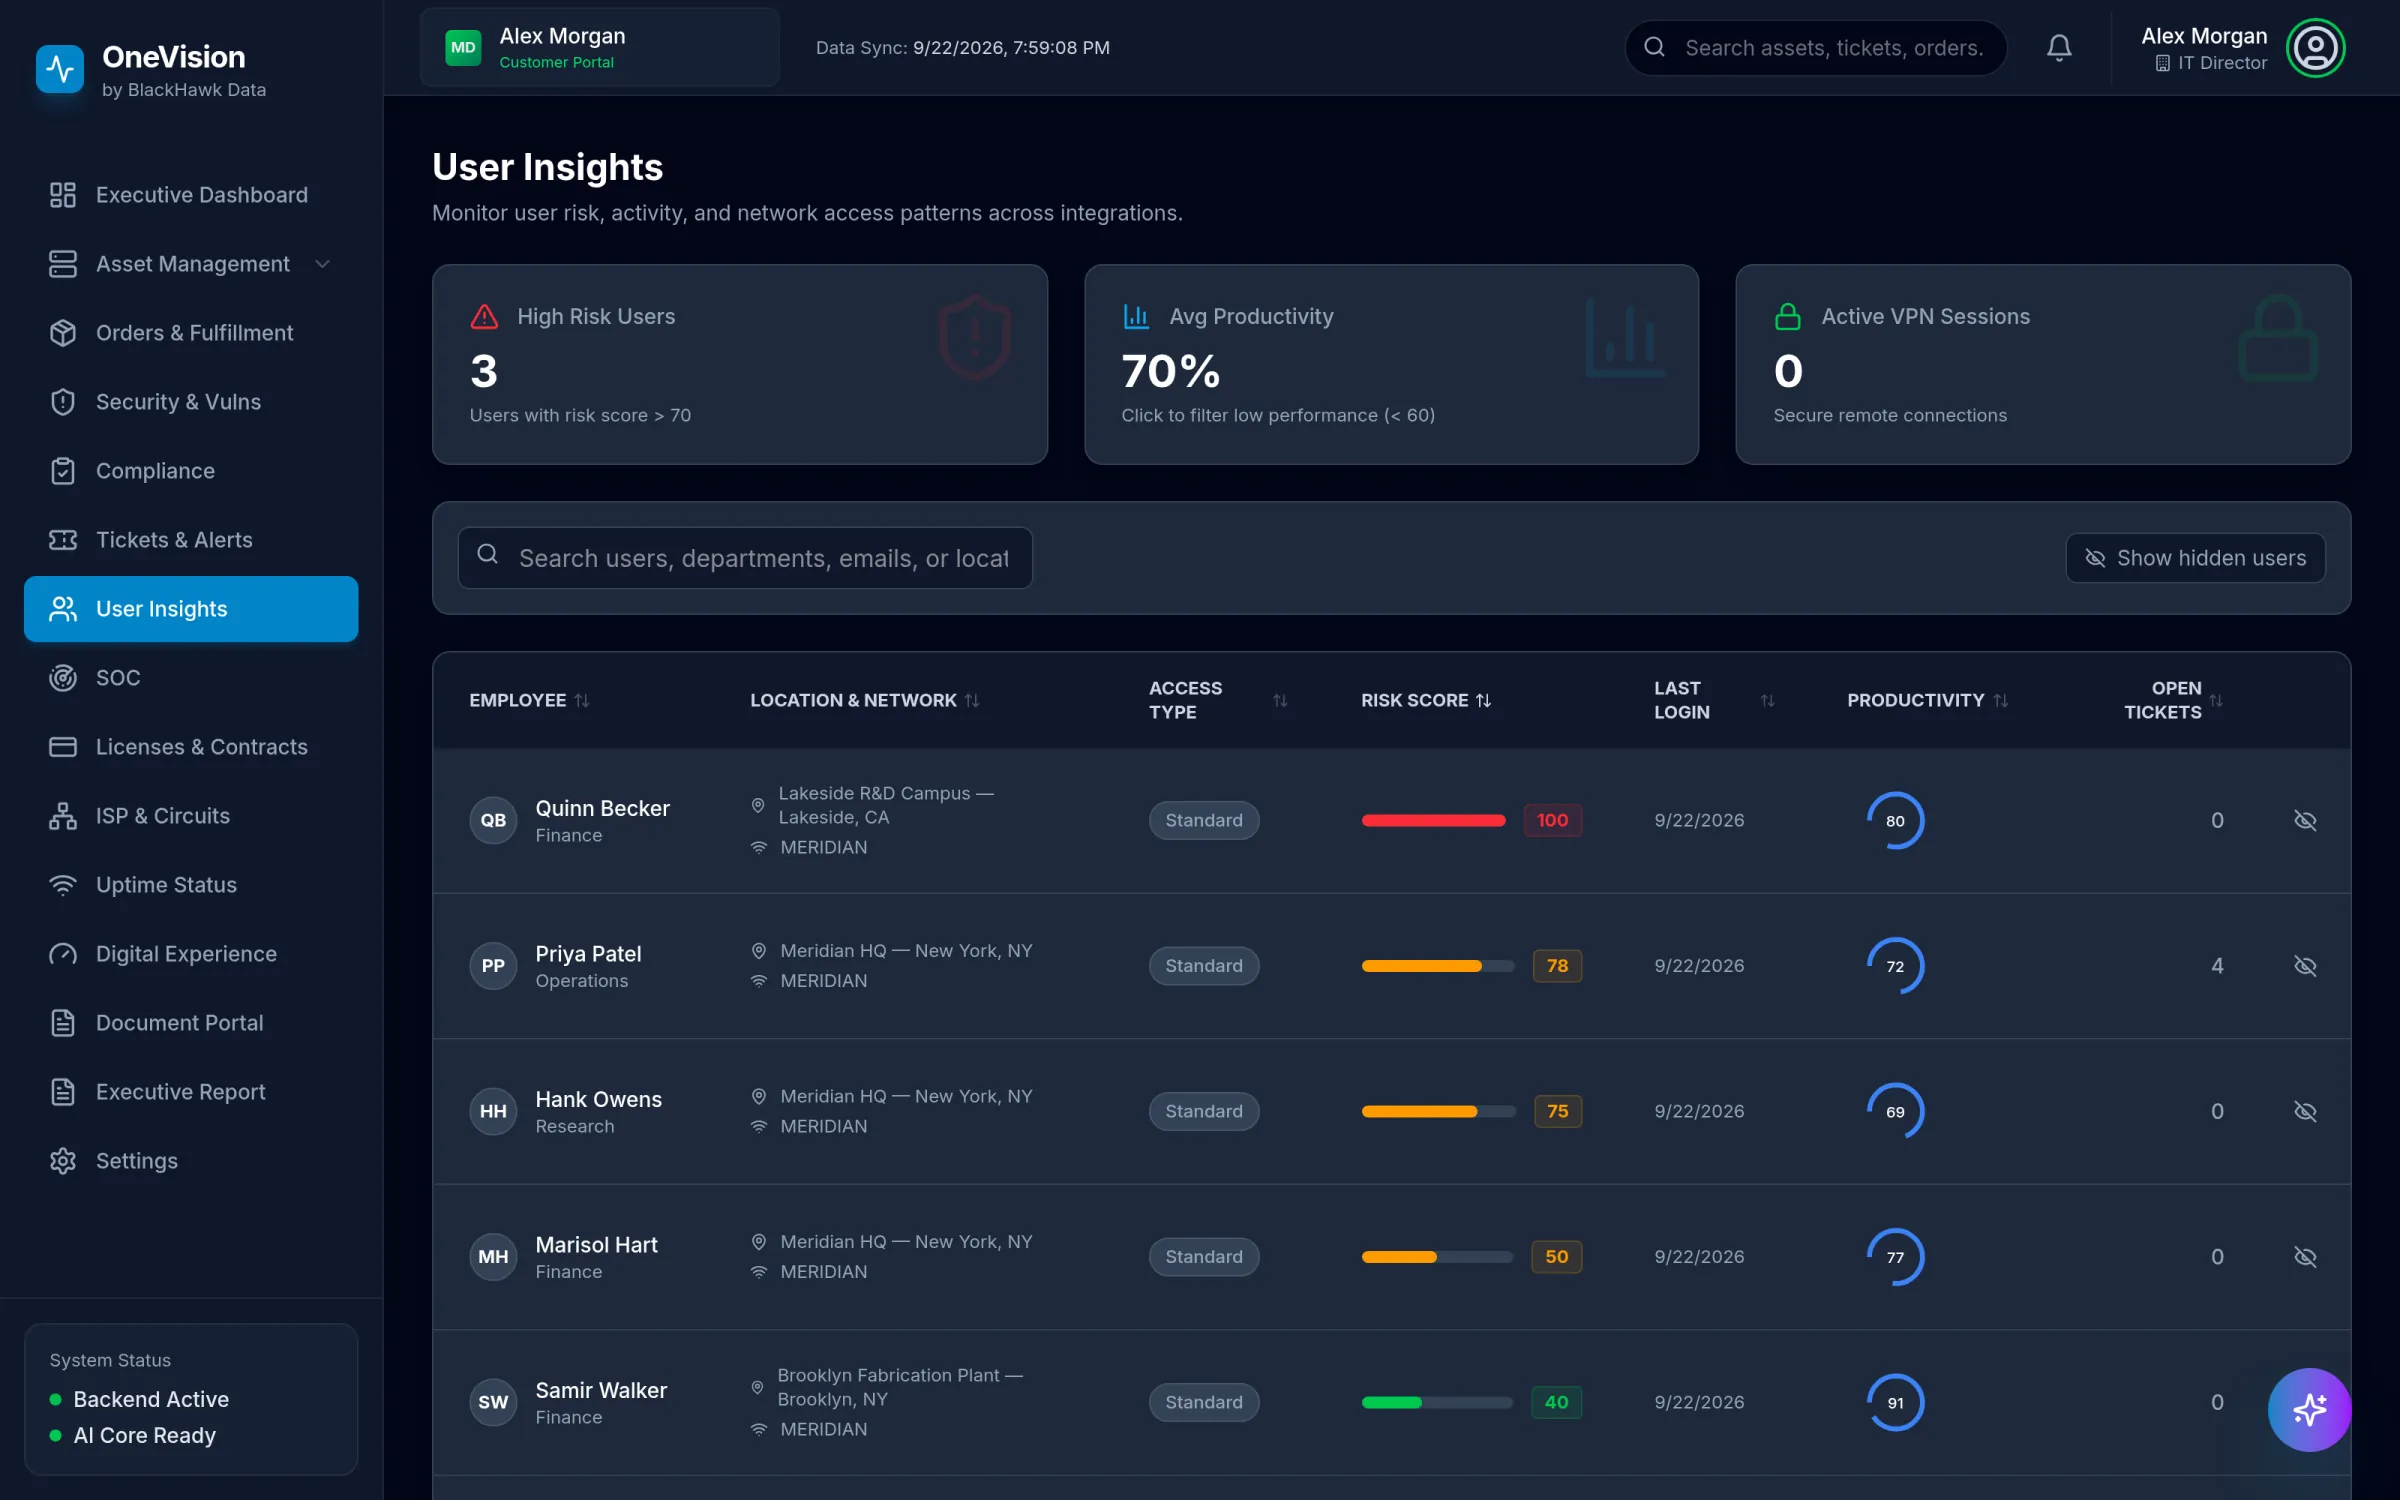
Each user gets a 0–100 risk score that blends security incidents, identity signals, device health and ticket history, plus a productivity signal from real usage.

05.2

Every score is explainable.

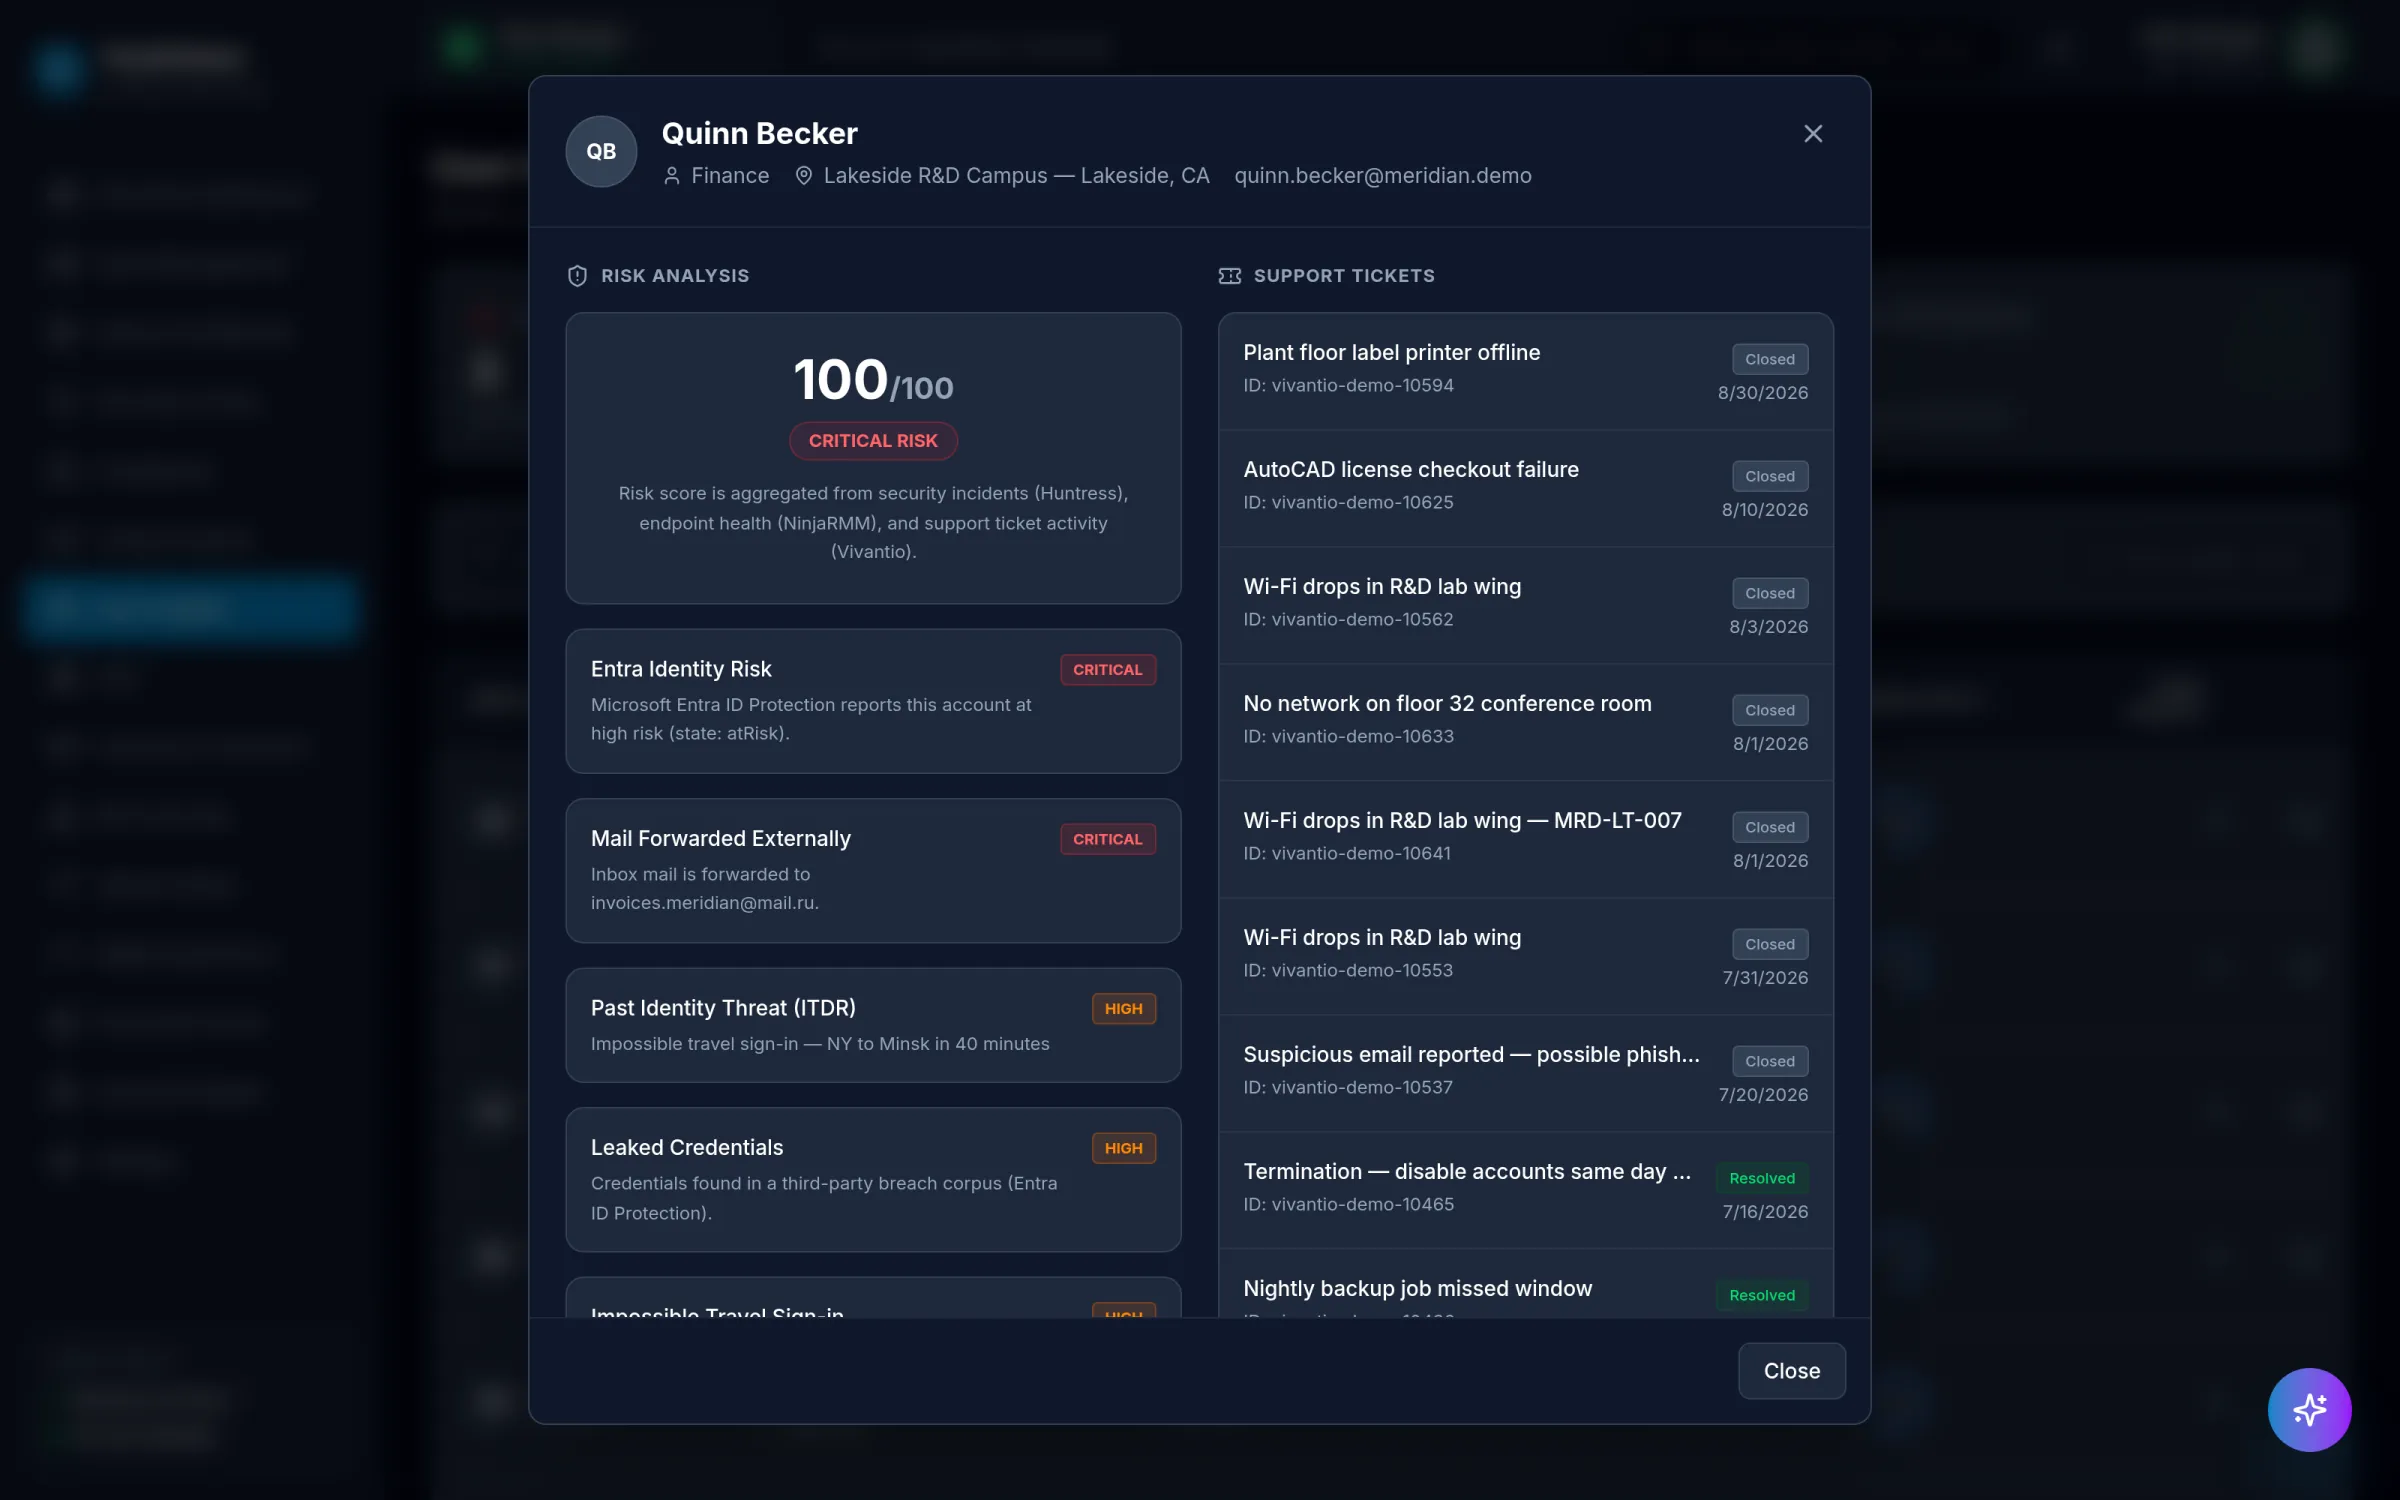
Open a user and the evidence is right there — Entra ID Protection risk, external mail forwarding, leaked credentials, impossible-travel sign-ins — next to their ticket history.

ONEVISION
User Insights table showing each employee's location, access type, risk score, last login, productivity and open tickets.
User detail showing a critical risk score with contributing factors such as Entra identity risk and external mail forwarding, beside the user's support tickets.
1Risk 0–100, correlated across every source
2Users above 70 — one click to filter
3Productivity from real usage
1Critical risk — and the reasons why
2Microsoft Entra ID Protection signals
3External mail forwarding, caught automatically
Licensing & cost

Find the money you're paying for nobody.

06.1

Every seat, checked against real use.

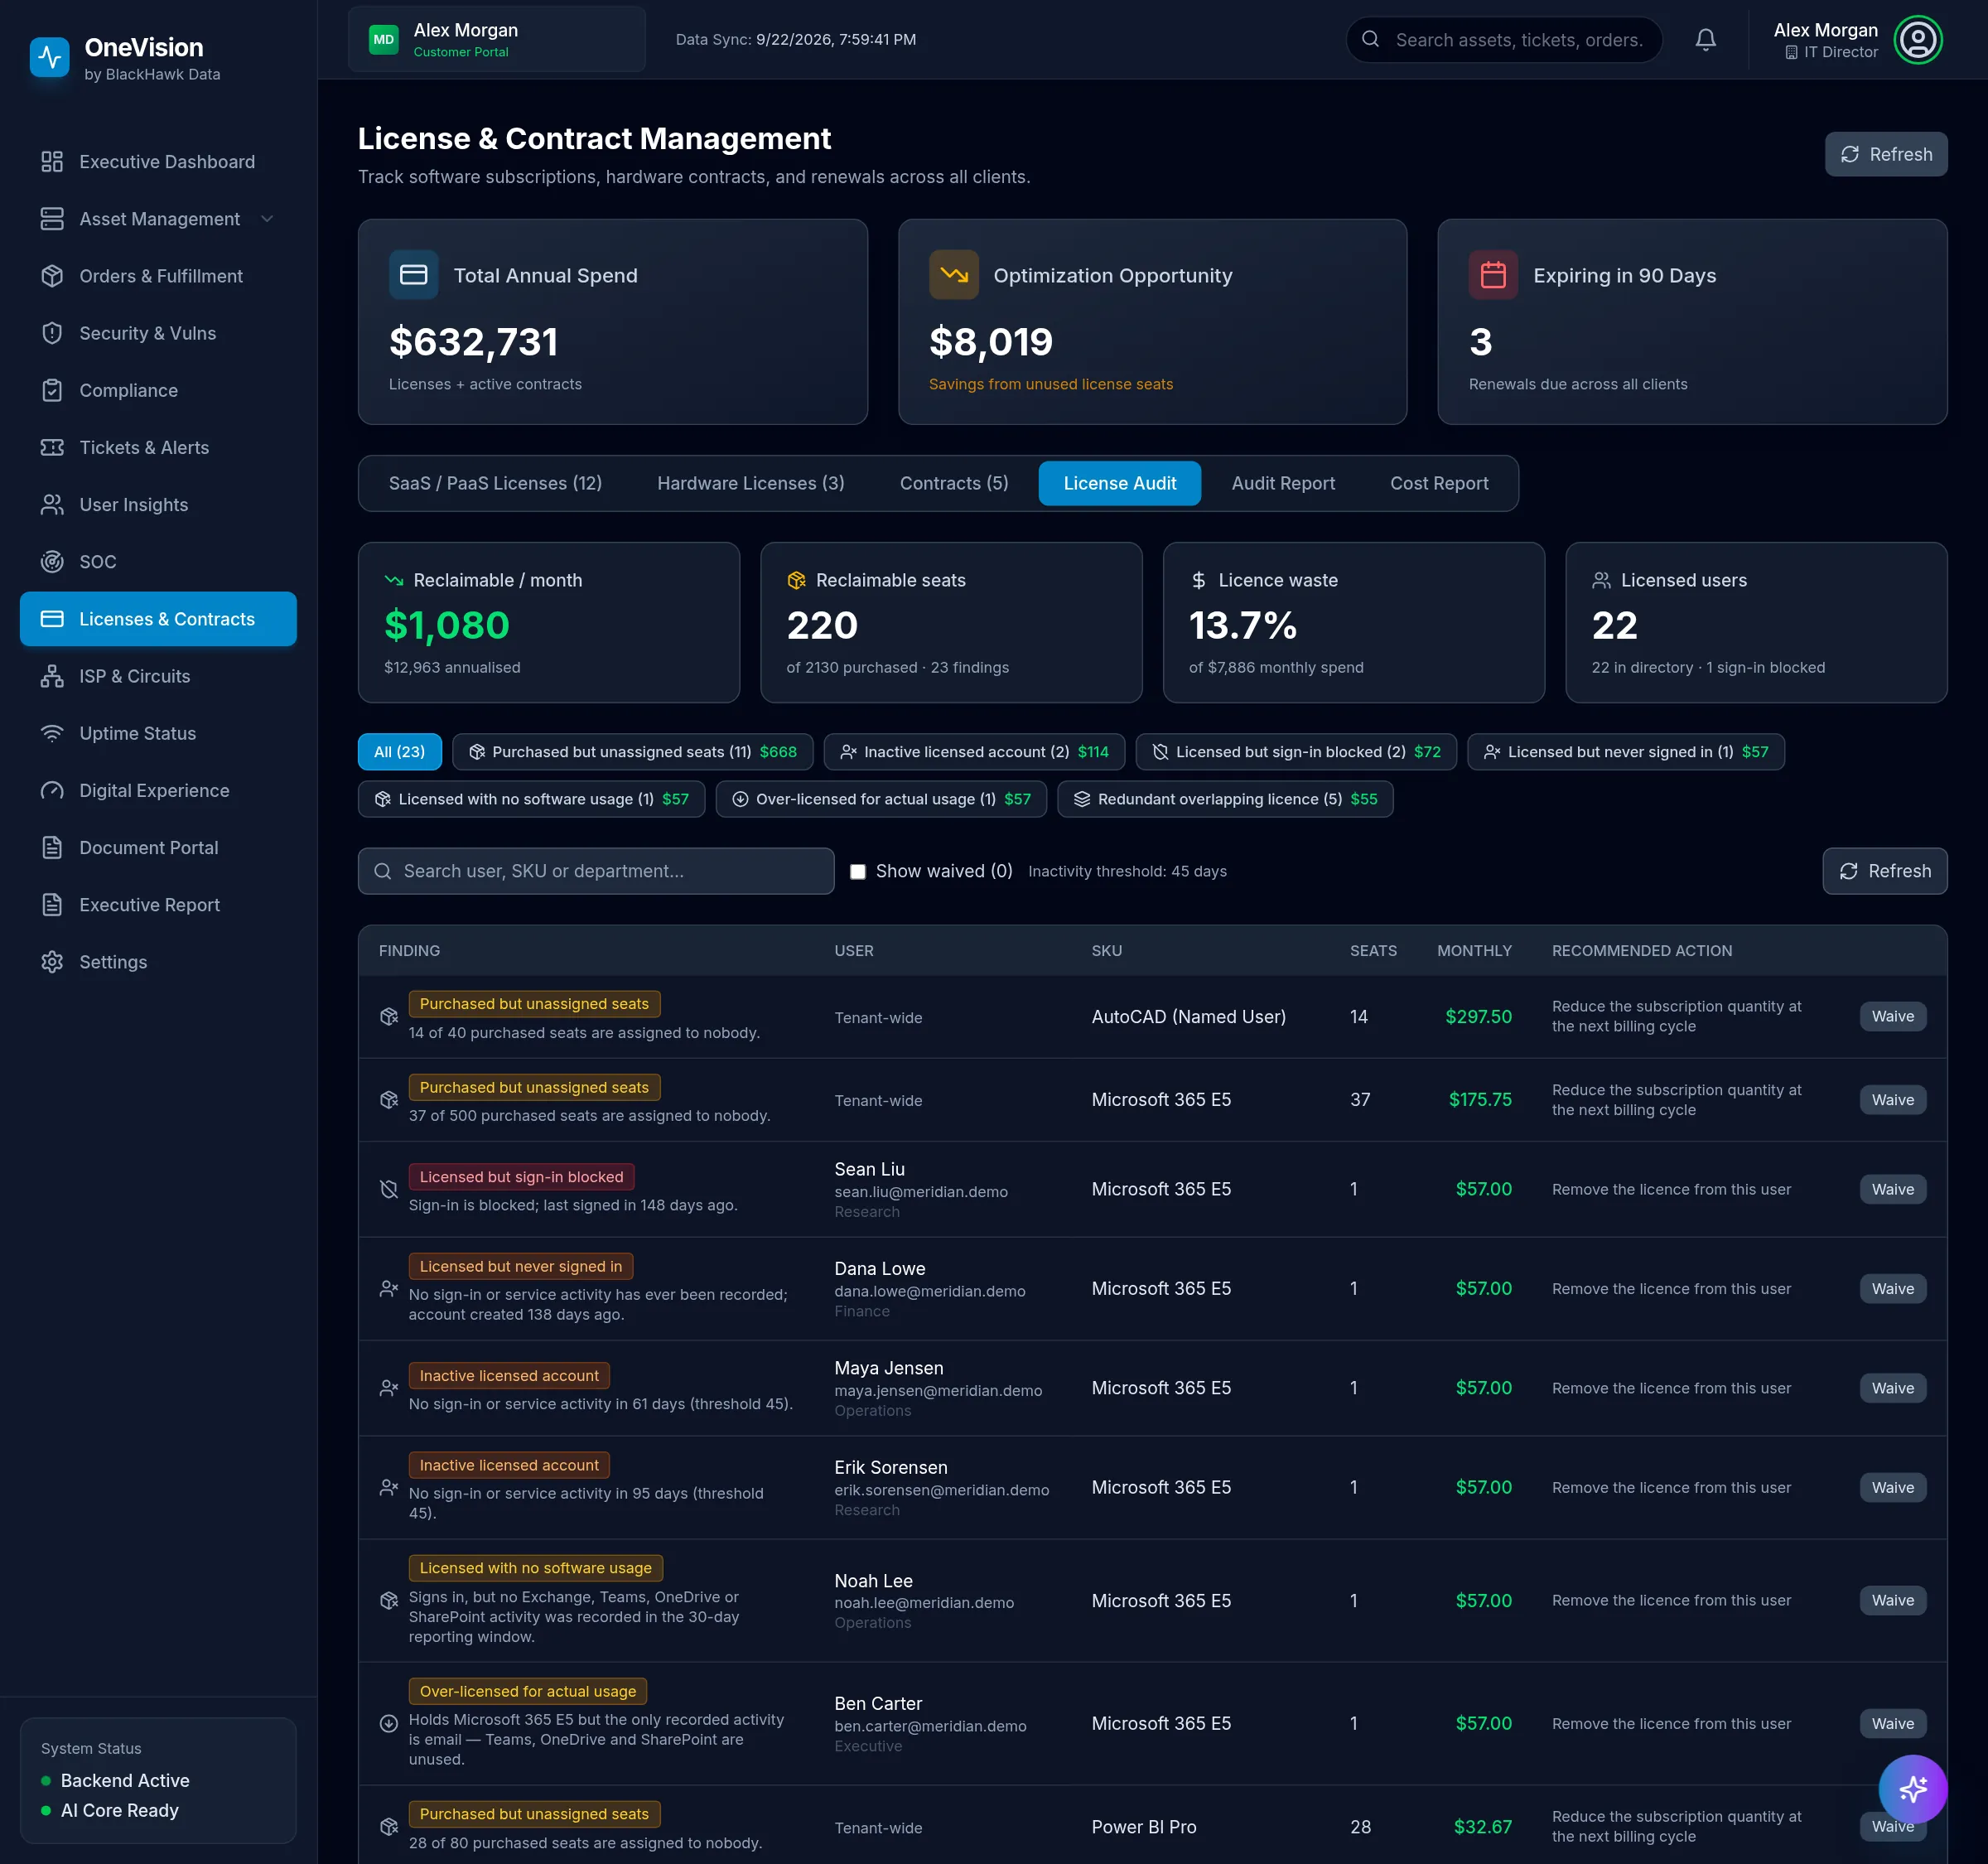
OneVision audits each Microsoft 365 license against sign-ins and actual service usage, then prices what could be reclaimed — per finding, per month.

06.2

Findings a person can act on.

Blocked accounts still holding licenses, people who never signed in, E5 holders who only use email, overlapping products — each one named, priced and waivable with a reason.

06.3

One score for license health.

A License Efficiency Score weighs seat utilization, spend efficiency, cost confidence and license hygiene — and shows exactly how it got there.

06.4

A plan, ranked by impact.

Every recommendation carries its annual dollar value and the reasoning behind it, in a report you can export to PDF or CSV and hand straight to finance.

ONEVISION
License Audit showing reclaimable spend per month, reclaimable seats, license waste percentage and a table of findings with recommended actions.
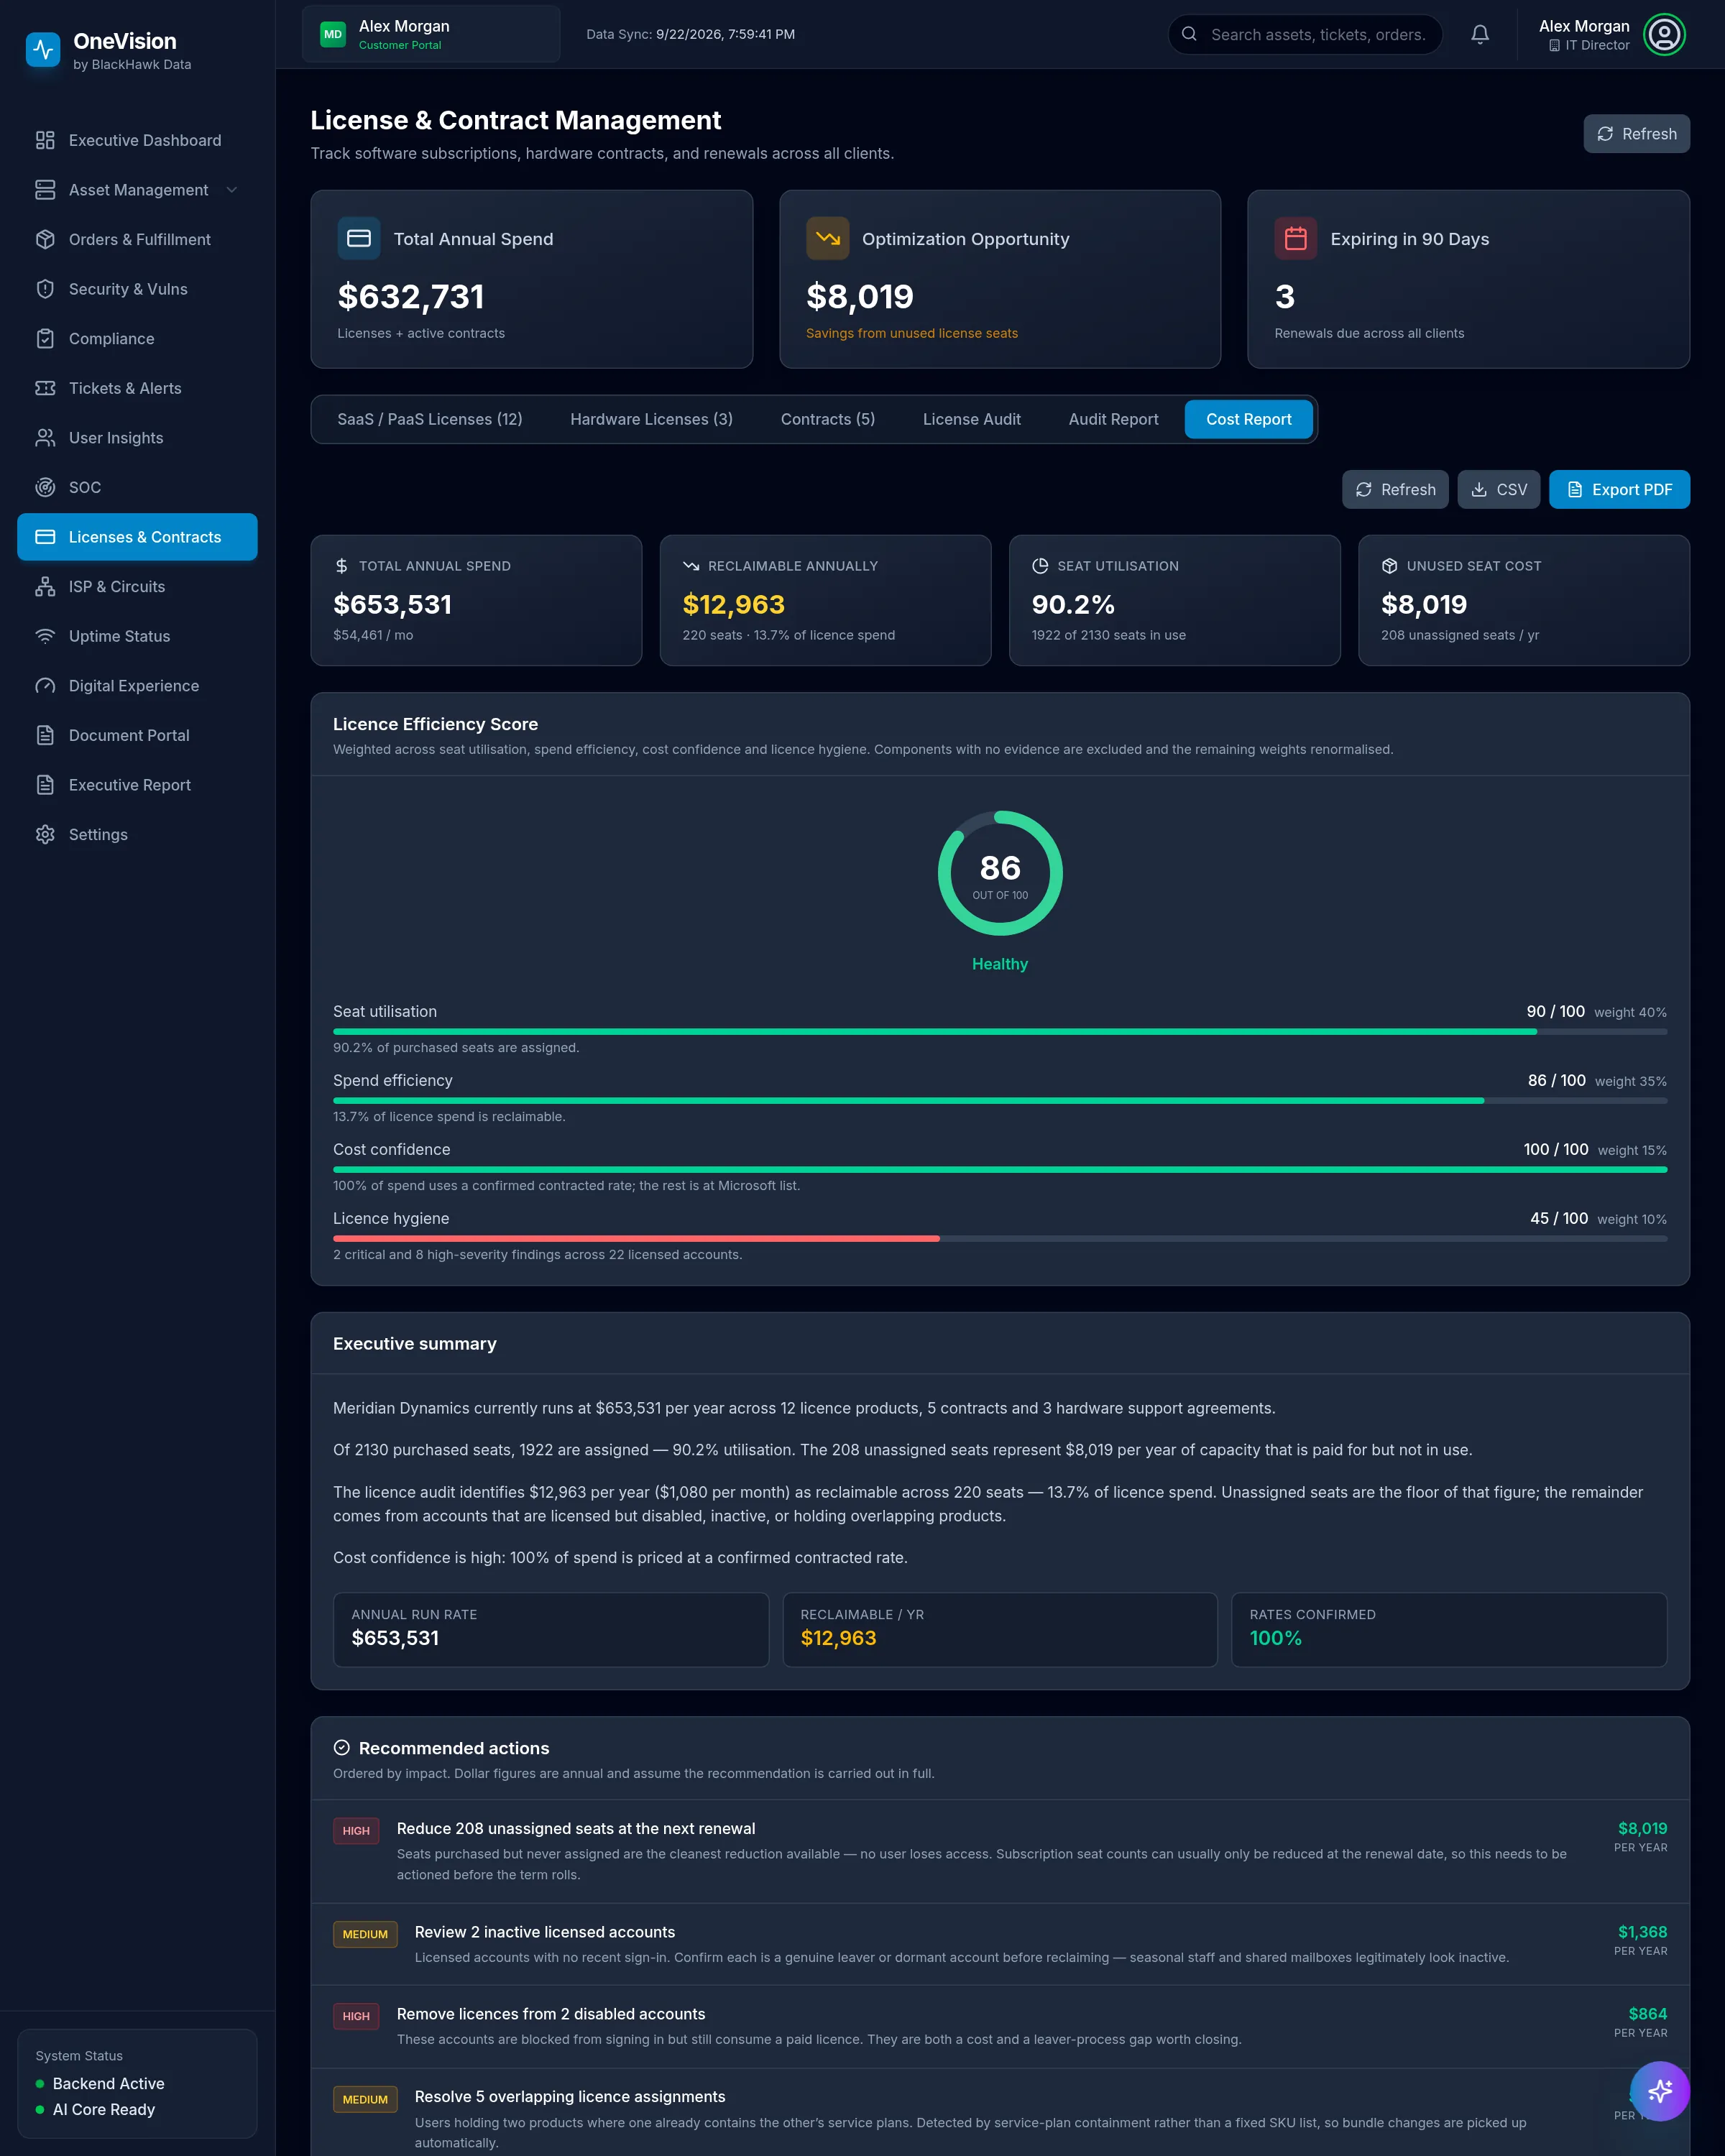
License and Contract Cost Report with annual spend, reclaimable amount, seat utilization, a License Efficiency Score, an executive summary and ranked recommended actions.
1$1,080 a month reclaimable — $12,963 a year
2Seven finding types, each with its dollar value
3A recommended action on every finding
1Sign-in blocked, still holding a paid license
2E5 license, but only email is used
3Priced per month from your rates
186 / 100 — healthy
290.2% of 2,130 seats in use
3Four weighted components, all shown
1A written summary finance can read
2Ranked by impact
3$8,019 a year from one change
Service & experience

Service you can see. Uptime you can prove.

07.1

Every ticket and alert, one queue.

Service-desk tickets and monitoring alerts together, linked to the devices they affect. Response-time SLAs are measured for each client, and time spent waiting on you is shown, not hidden.

07.2

Uptime you can prove.

Sites and services monitored around the clock, with 24-hour and 30-day uptime, response-time history and SSL certificate expiry — so the first alert isn't a user calling.

07.3

Digital experience, from the user's side.

Edge sensors score what people actually feel — DNS, gateway, internet, applications, voice and Wi-Fi — per site, with root-cause findings when something slips.

ONEVISION
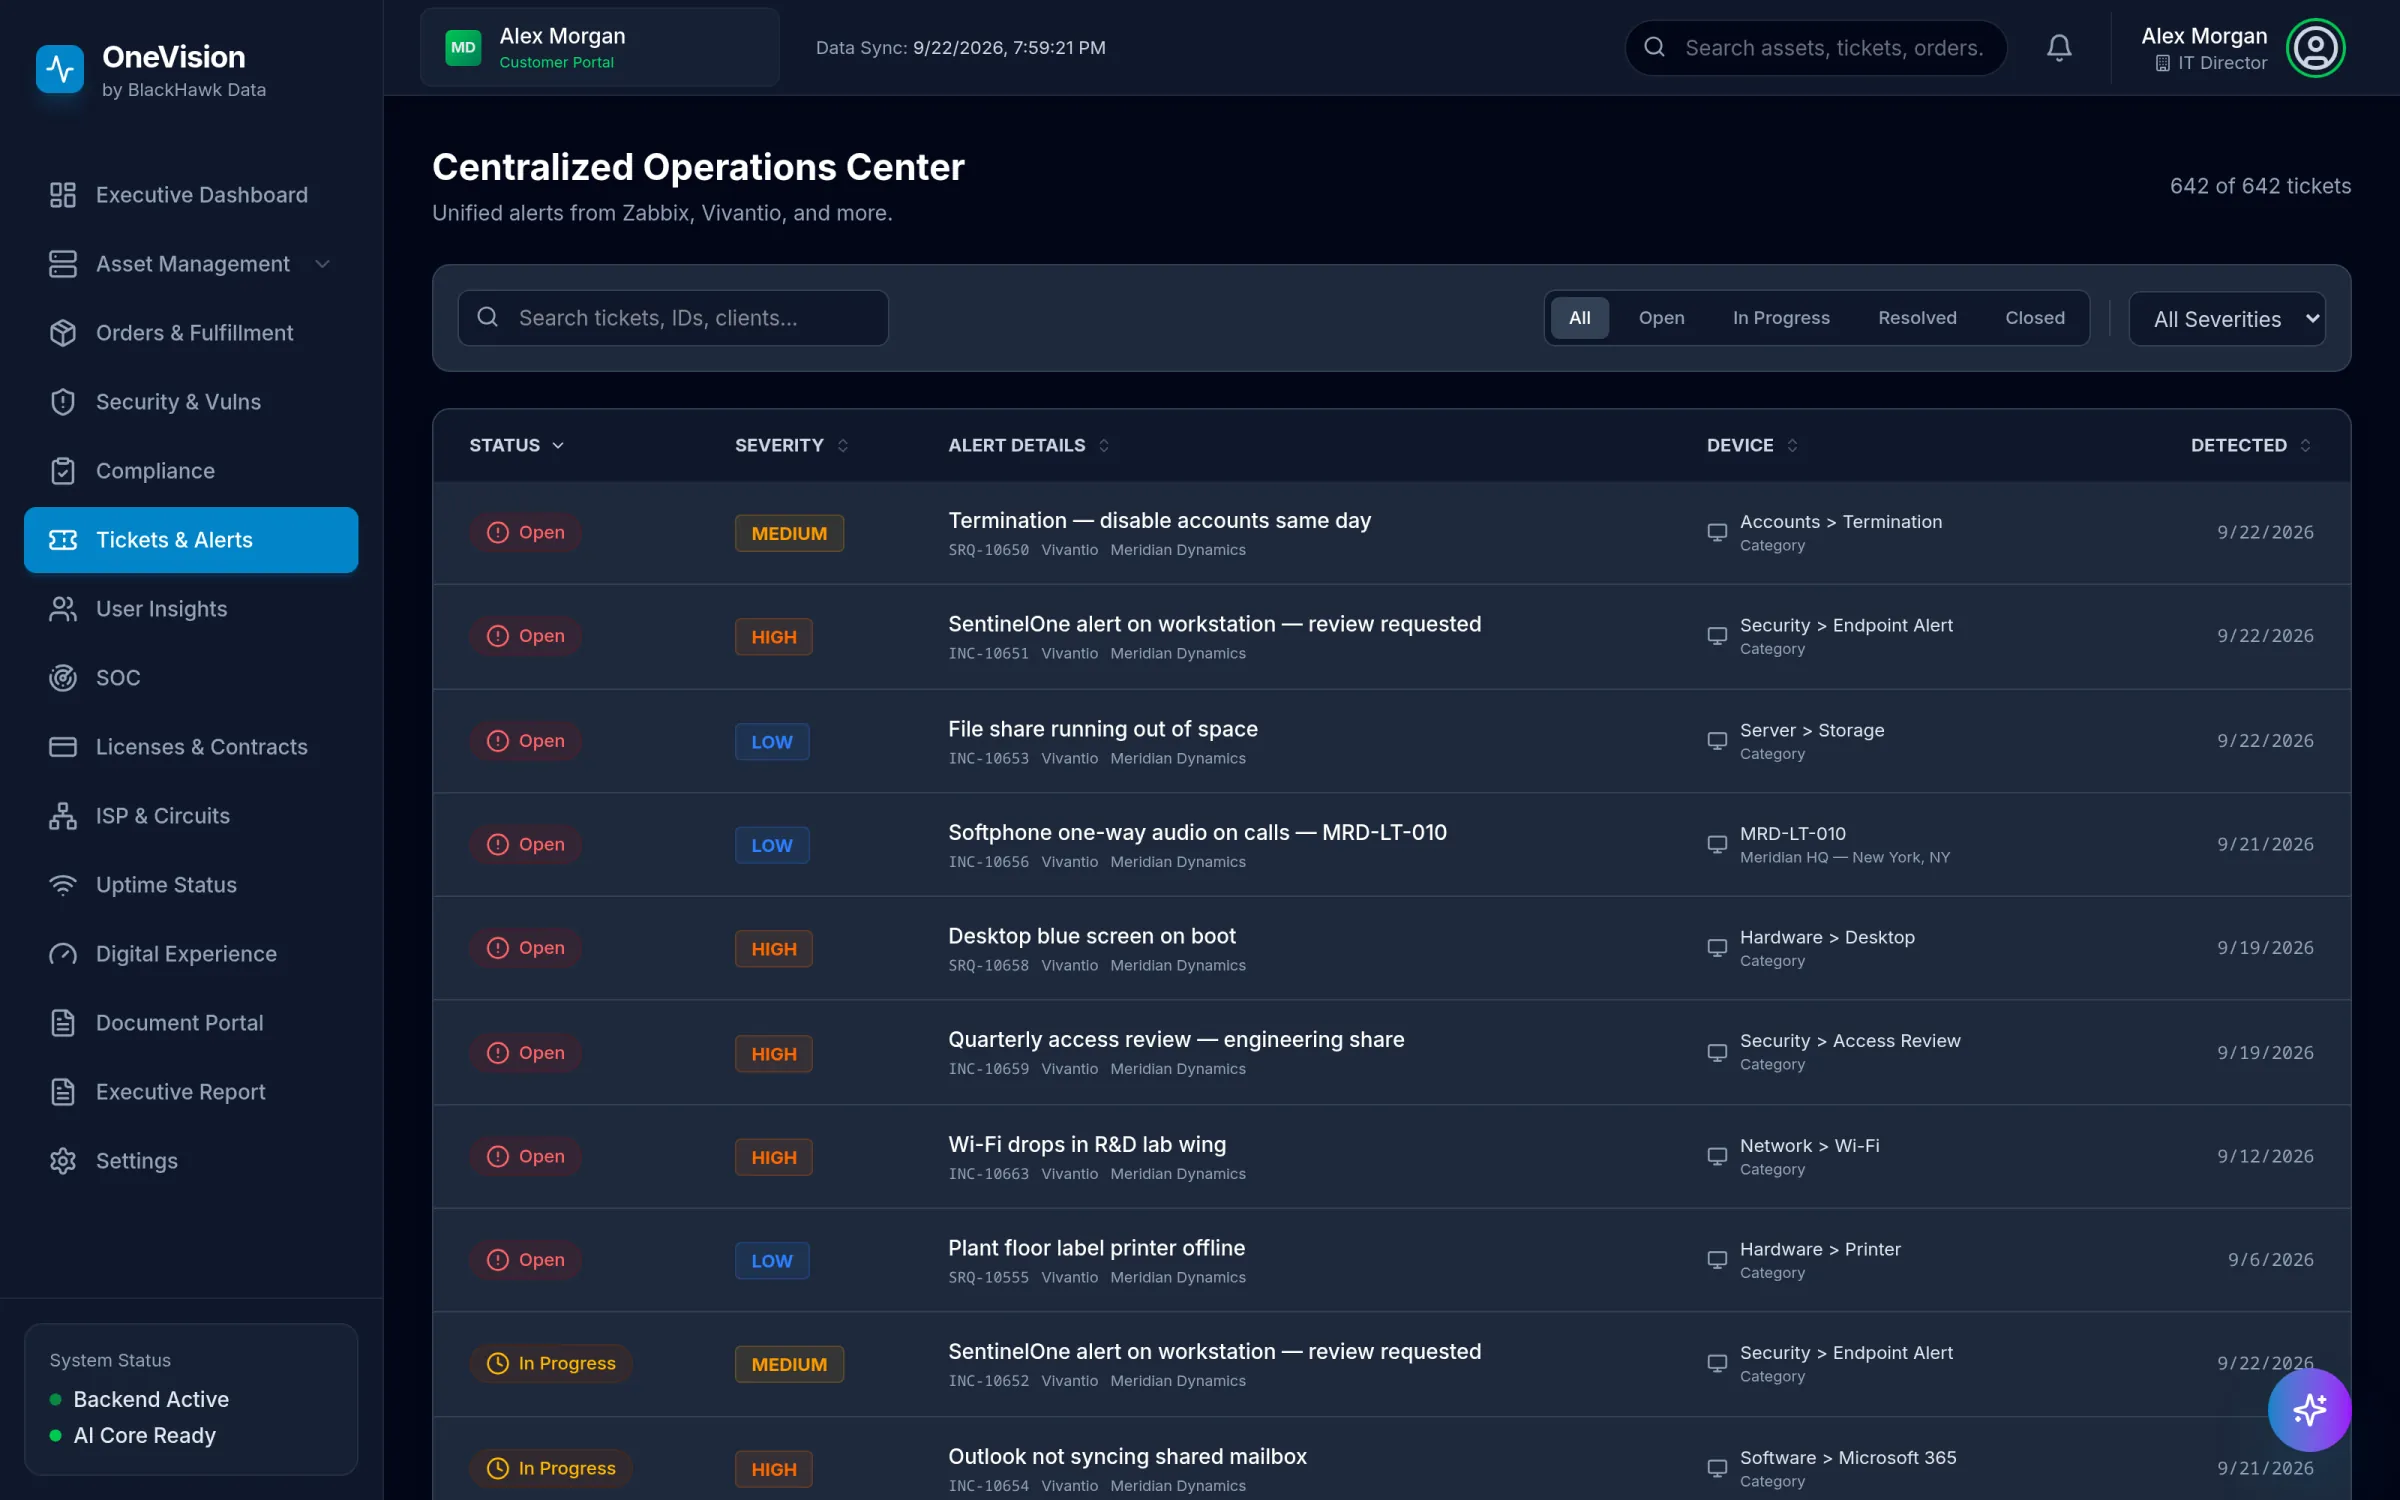
Operations Center ticket list with status, severity, alert details, device and detection date, filterable by status and severity.
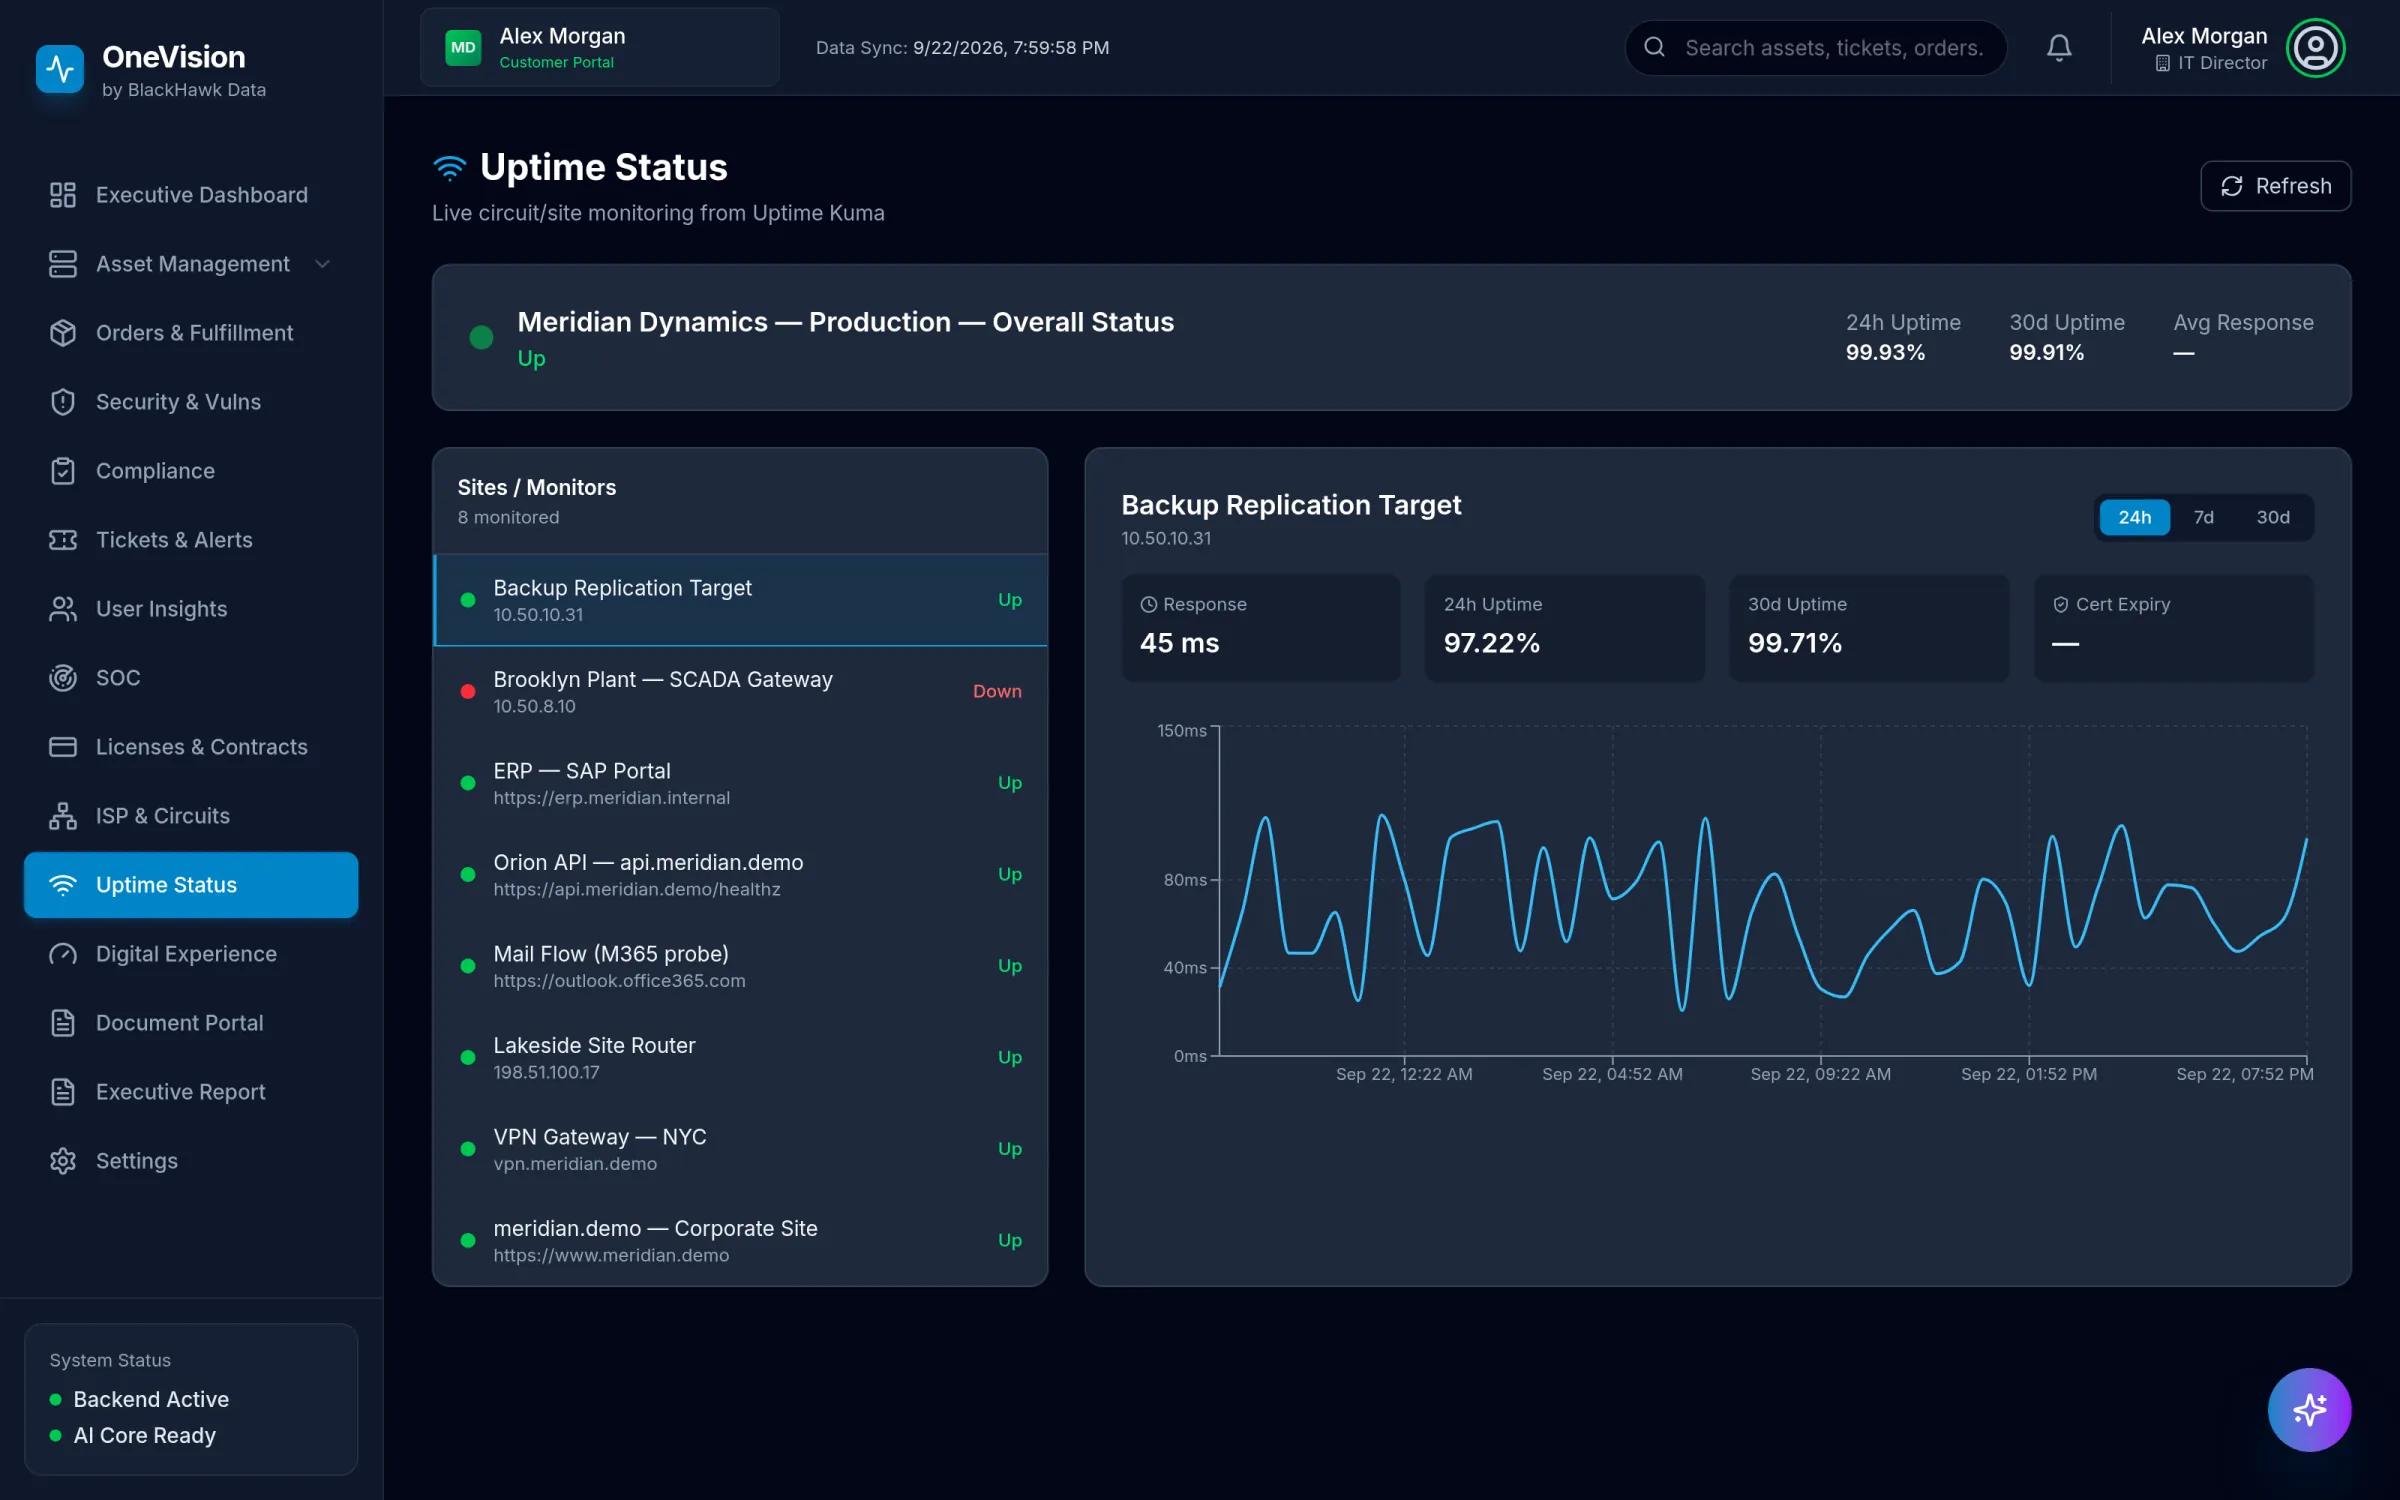
Uptime Status with overall 24-hour and 30-day uptime, a list of monitored sites marked up or down and a response-time chart.
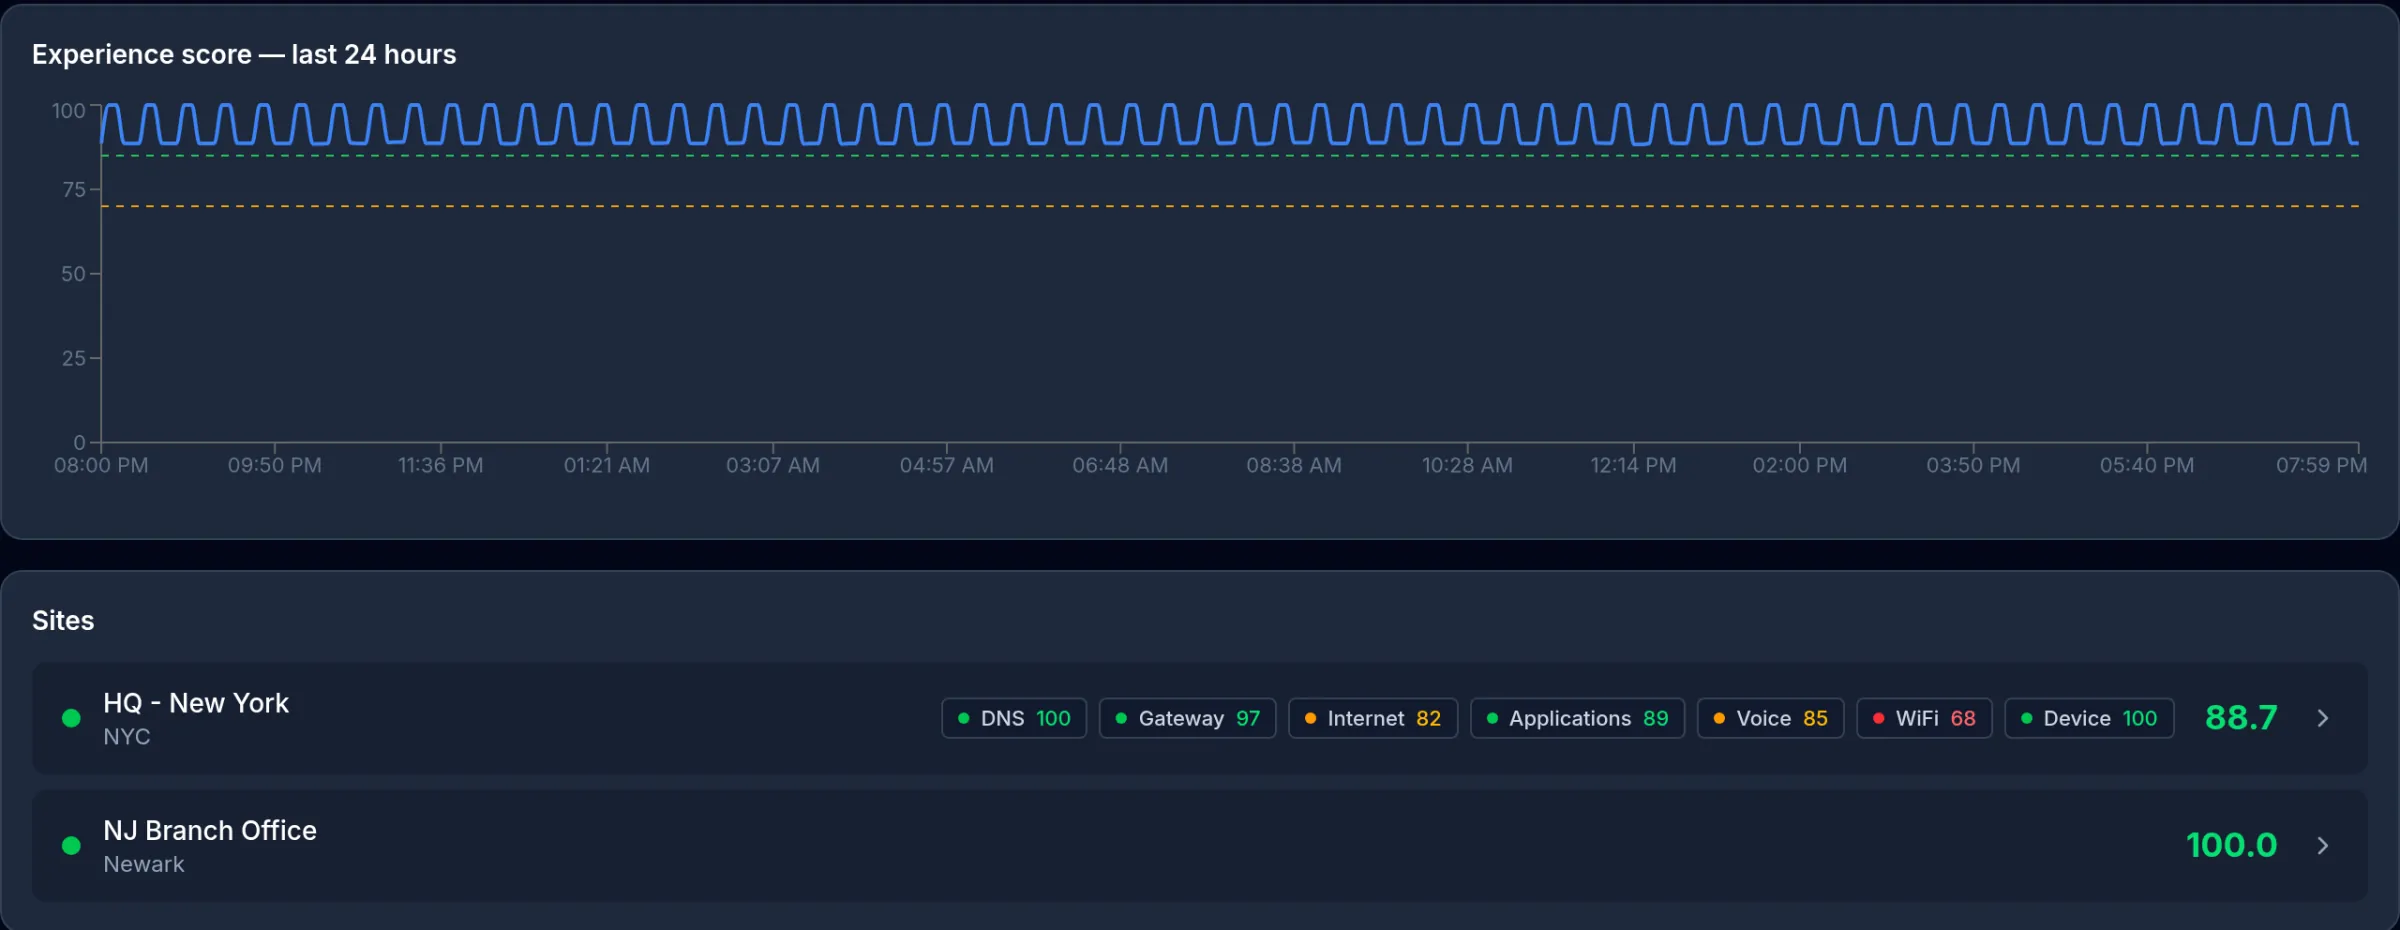
Digital Experience score over 24 hours and per-site scores for DNS, gateway, internet, applications, voice, Wi-Fi and device.
1Tickets and alerts, linked to devices
2Filter by status and severity
3Full history, searchable
199.91% over the last 30 days
2A down site turns red the moment it drops
3SSL certificate expiry tracked
1Experience score, around the clock
2Scored per category, per site
3Weakest link called out: Wi-Fi at 68
Procurement & AI

From purchase order to plain-English answers.

08.1

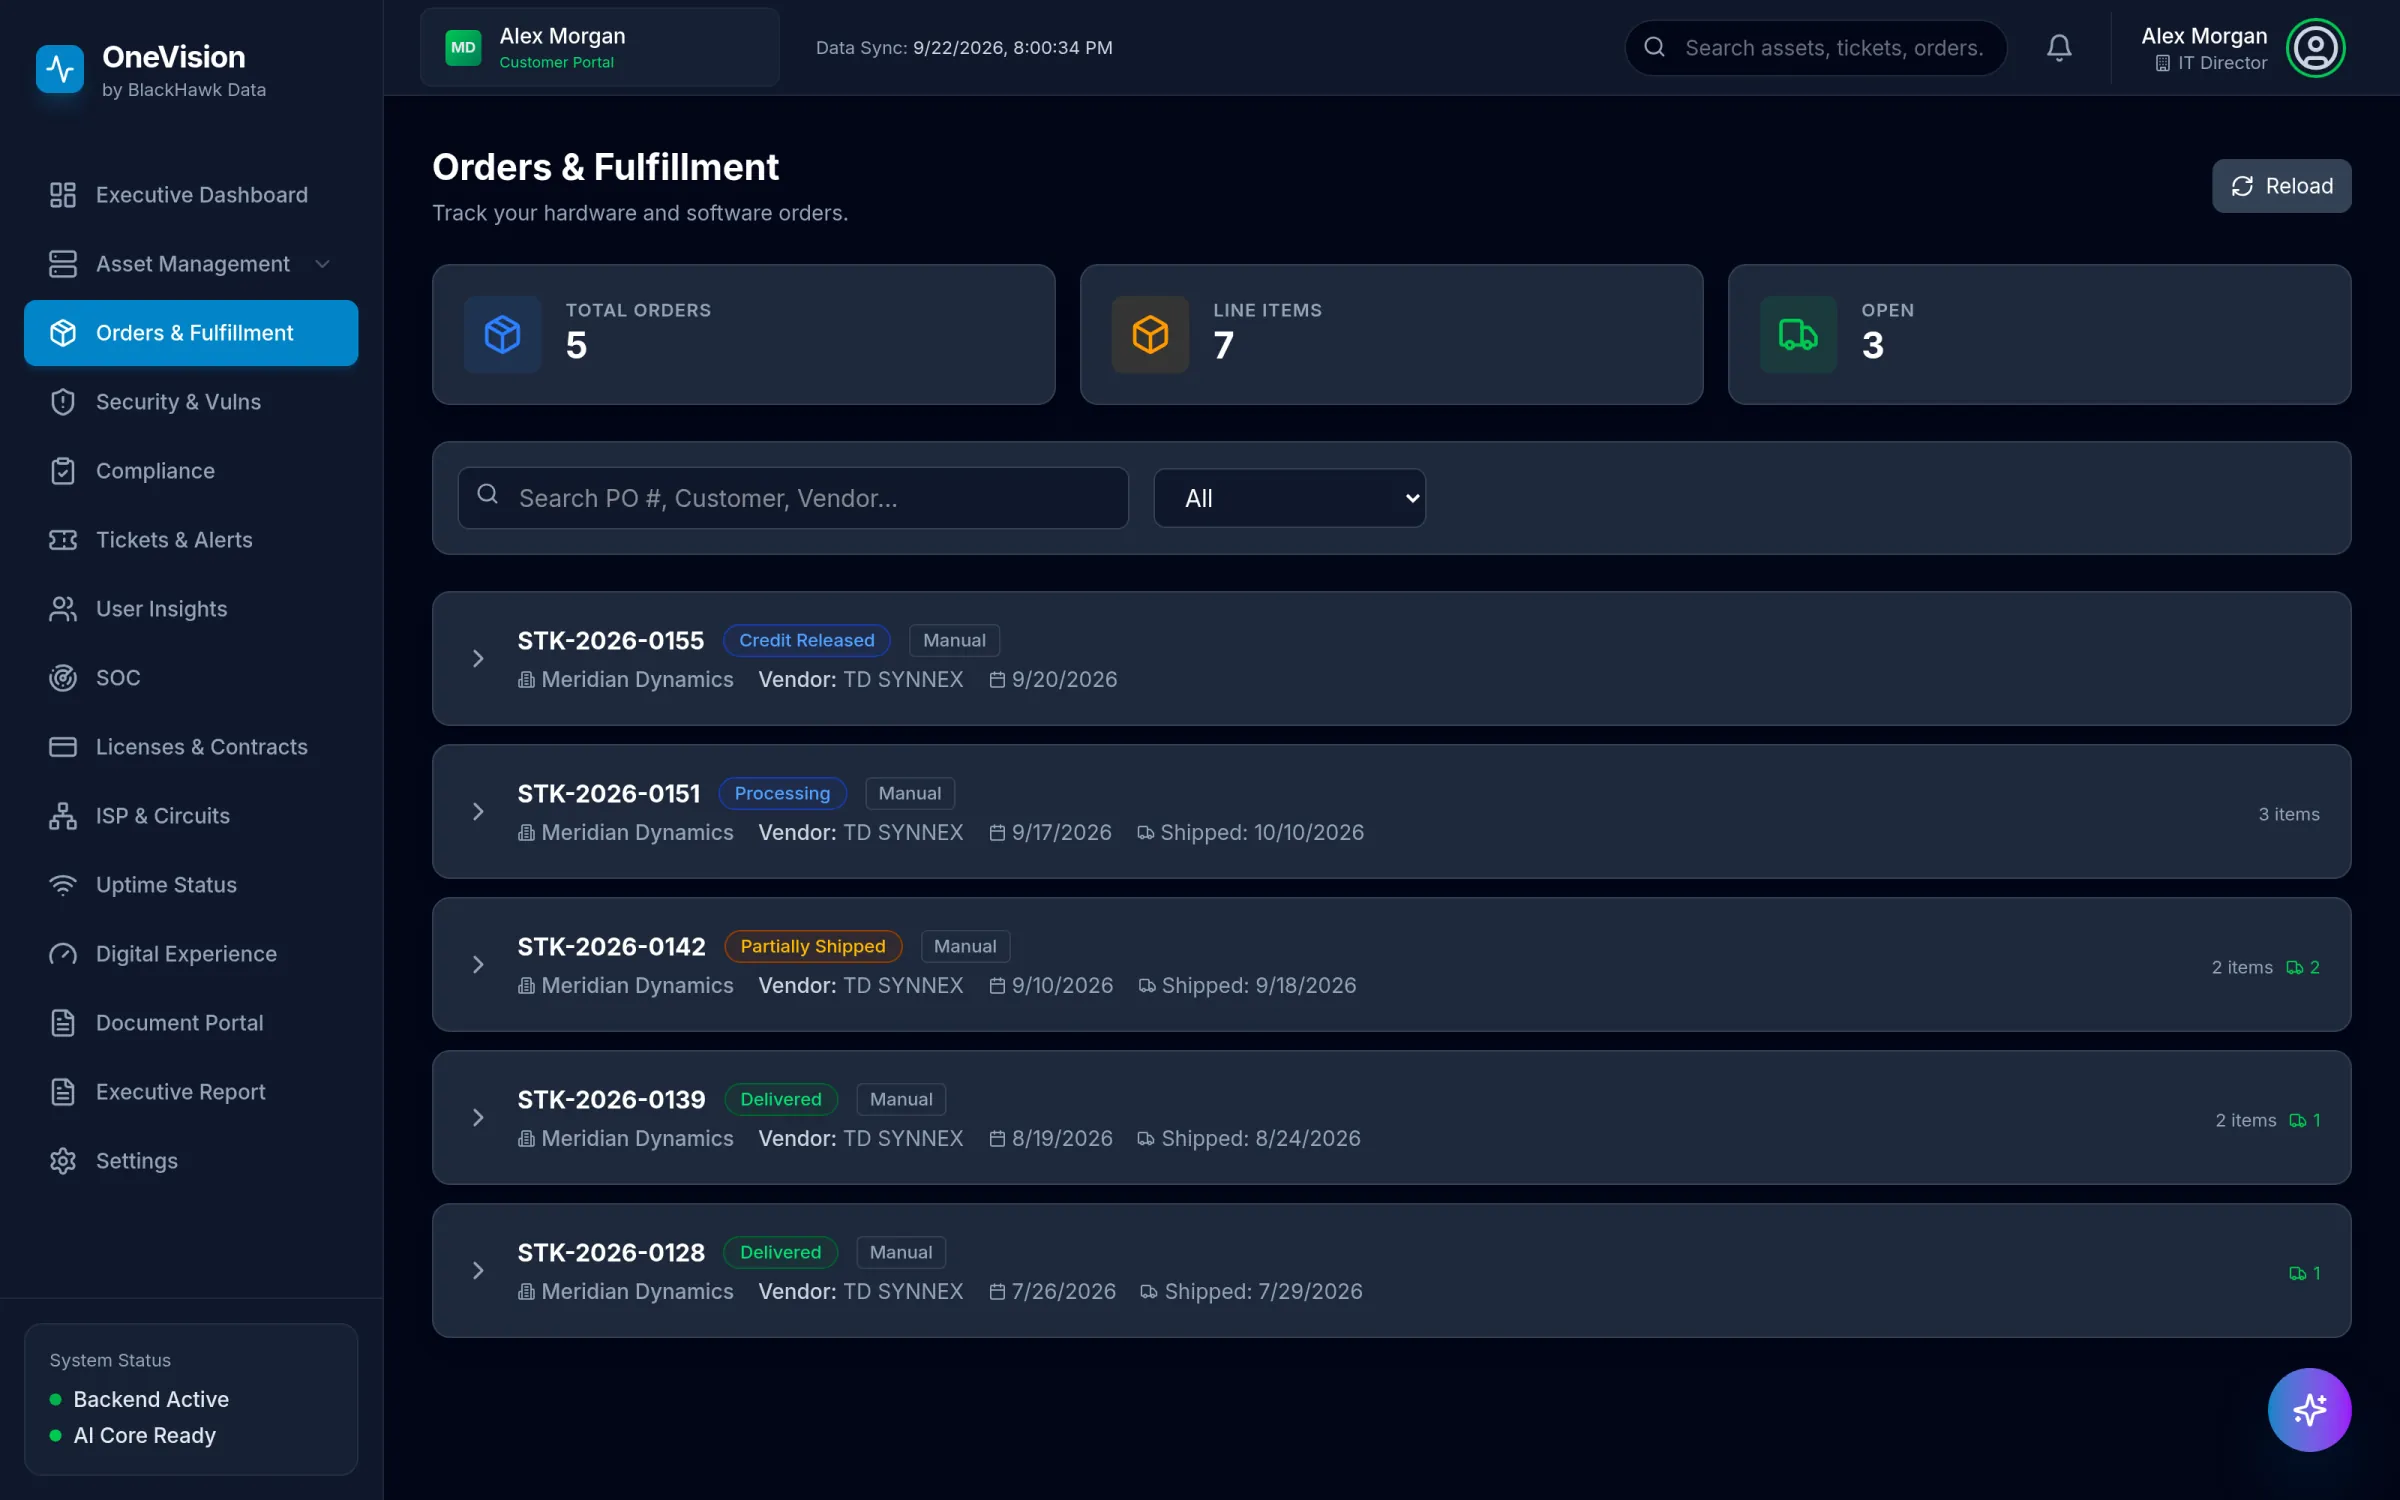
Orders tracked from PO to doorstep.

Hardware and software orders from the distributor, normalized into clear statuses with ship dates, carrier tracking and serial numbers.

08.2

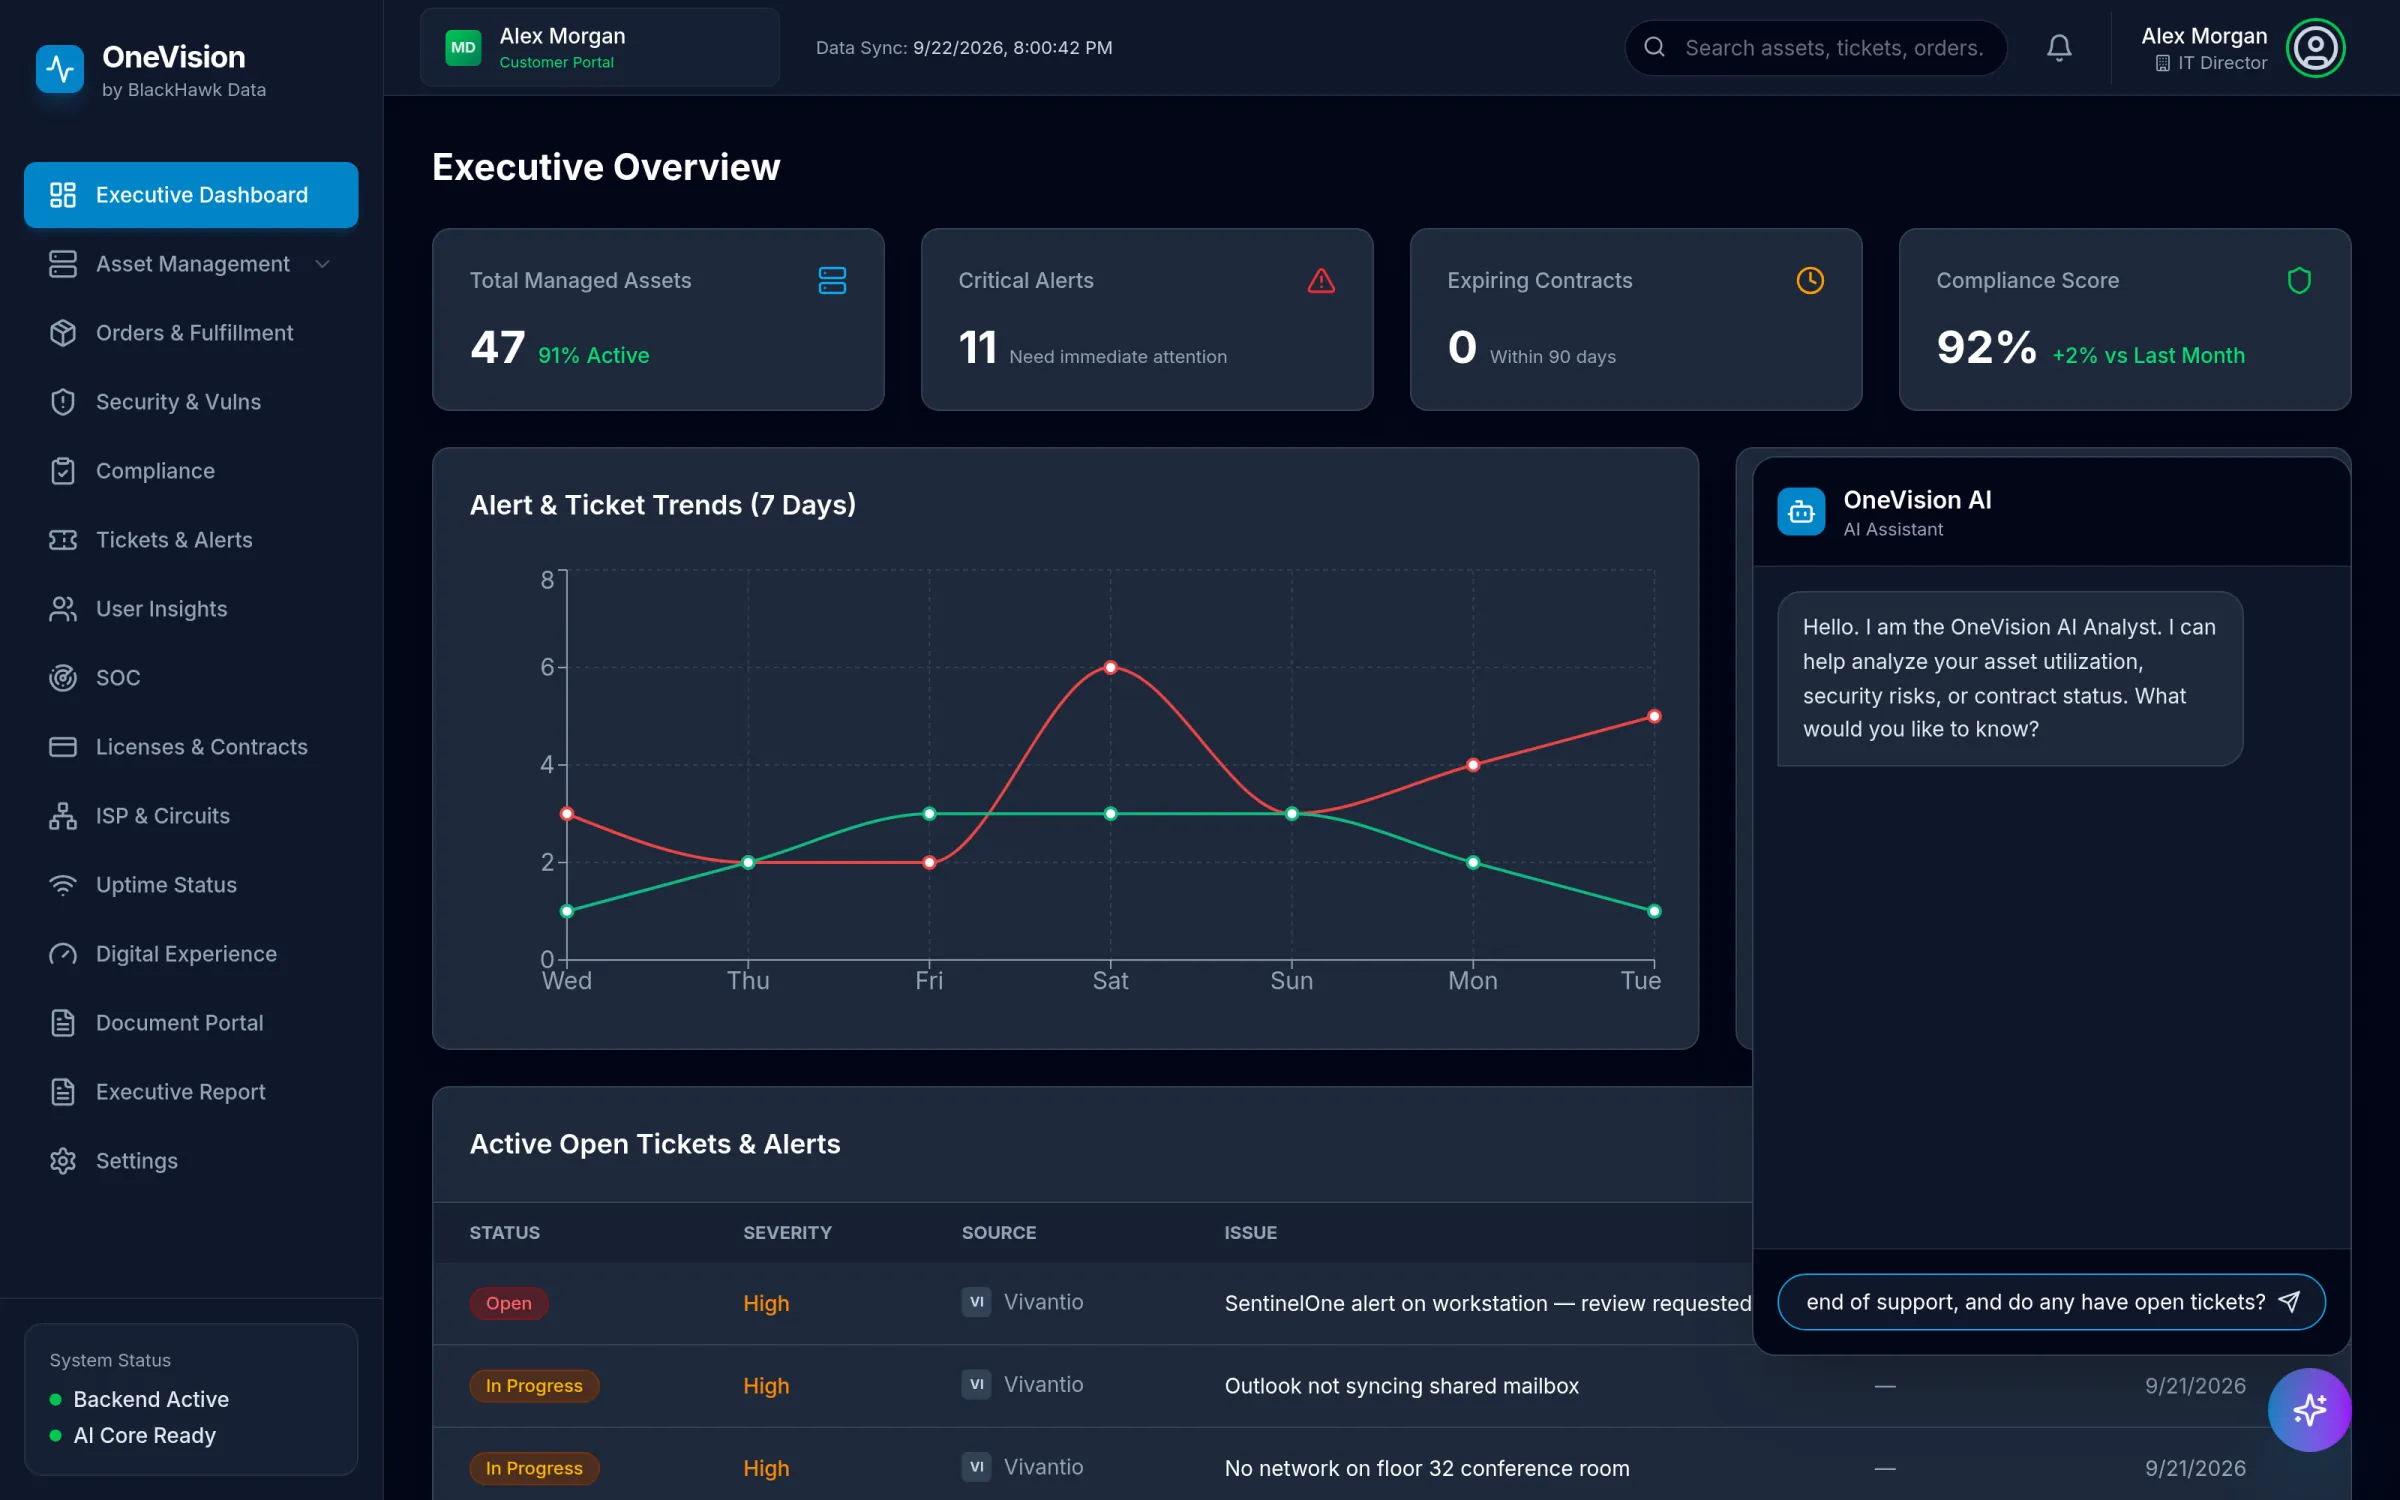
Ask it anything, in plain English.

The OneVision AI Analyst answers questions about your assets, risks, tickets and licenses using your own data — no report builder, no exports.

ONEVISION
Orders and Fulfillment list with purchase orders, statuses such as processing, partially shipped and delivered, vendor and ship dates.
OneVision AI Analyst chat panel open over the dashboard with a question about devices past end of support being typed.
1Clear statuses, from processing to delivered
2What's still open, at a glance
3Ship dates and carrier tracking
1Answers grounded in your environment's data
2Ask the way you'd ask a colleague
The monthly report

The executive report that writes itself.

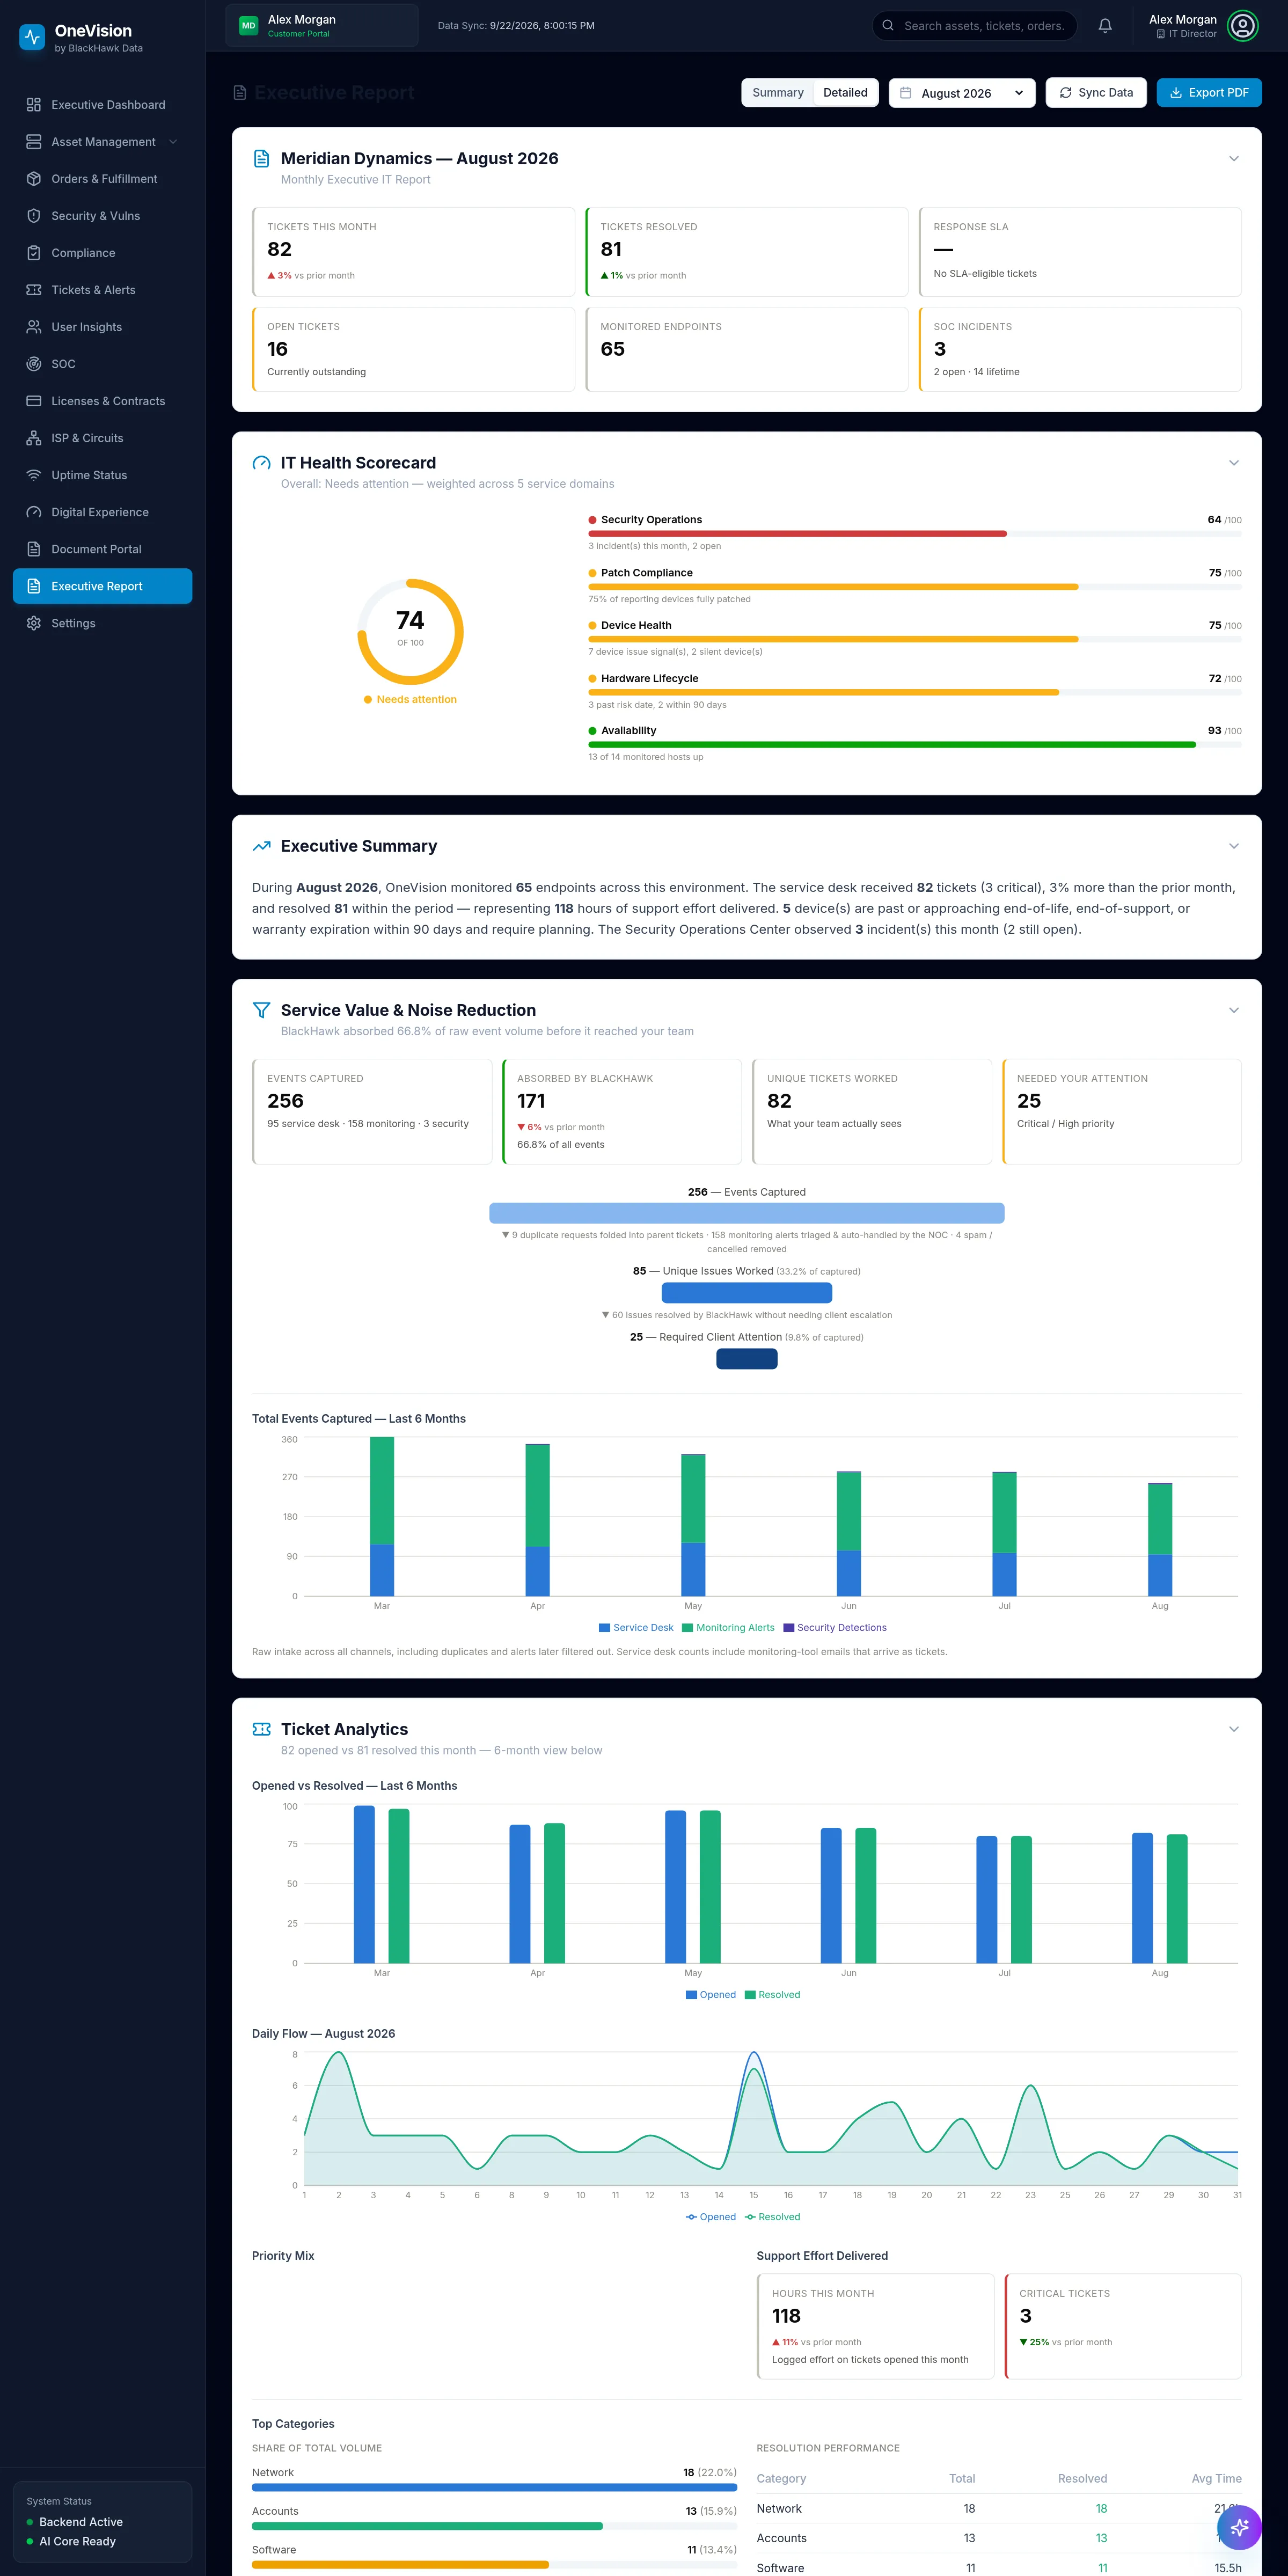
Page 1 · Scorecard

Scored, not guessed.

One IT health score, weighted across security, patching, device health, lifecycle and availability — with the reason behind every point.

Page 2 · Service value

Noise absorbed before it reaches you.

In the demo month, 256 raw events became 85 real issues — and only 25 needed the client's attention.

Page 3 · Trends

Trends, not snapshots.

Six months of intake by source, opened versus resolved, and the daily flow — context a single month can't give you.

Page 4 · Effort

Effort, accounted for.

Hours delivered, critical tickets and top categories every month — exported as a branded PDF in one click.

ONEVISION · EXECUTIVE REPORT
Monthly Executive IT Report: ticket KPIs, a 74 out of 100 IT health scorecard, a written executive summary, a service value funnel, six-month trends and ticket analytics.
1Branded PDF, one click
2IT Health Score across five domains
3Security, patching, devices, lifecycle, availability
4A plain-English summary, written from live data
5171 of 256 events absorbed before they reached the client
6256 events → 85 issues → 25 needing attention
7Six months of intake, by source
8Opened vs. resolved, month over month
9118 hours of support effort, accounted for
What you get

Fewer consoles. Fewer surprises. More money back.

Visibility
12

Data sources, one pane

RMM, monitoring, service desk, SOC, identity, licensing, uptime and procurement — correlated by device and by person instead of spread across a dozen logins.

Savings
$12,963

Reclaimable license spend a year

Found by the license audit in the demo environment — 13.7% of license spend, with the action and dollar value on every finding.

Compliance
8

Frameworks, scored daily

From live evidence, with exceptions, attestations and remediation tracked to closure.

Service value
66.8%

Of event noise absorbed

Duplicates folded and monitoring alerts handled by the BlackHawk NOC before they reach your team (demo month).

Availability
99.91%

Uptime, measured

30-day availability, response time and SSL expiry on every monitored site, plus experience scores per location.

Risk
0–100

Explainable risk, for every user and device

Vulnerabilities ranked by real-world exploitation, and user risk built from identity, endpoint, SOC and service-desk signals — with the evidence attached.

Accountability
Monthly

A report your leadership will read

Health score, service value, SLA performance, lifecycle risk, SOC activity and recommended next steps, delivered as a branded PDF.

Figures shown are from OneVision's demo environment, which uses fictional data. Your results will differ.

Built for multi-tenant security

Your data stays yours.

01

Isolated at the database

Each client's data is separated with PostgreSQL row-level security, enforced on every query.

02

Credentials encrypted

Integration API keys are encrypted at rest with AES-256 and decrypted only by the service that uses them.

03

Your identity provider

Sign in with Microsoft Entra ID, or with one-time email codes and multi-factor authentication.

04

Role-based access

Separate admin, analyst and viewer roles, so everyone sees what they need and nothing more.

See it on your environment

One view. Every system. Starting now.

We'll walk you through OneVision live and show you what it surfaces across your own tools.